Synchrotron Data Analysis Software Platform
Software
All softwareBrowse the full catalogueImagingCT, Ptycho, BCDI, HoloDiffraction & scatteringPDF, SAXS, BMX, XPCSSpectroscopyXAS, XRF, XRS, PCA/LCFData toolsConversion, cropping and formatsArtificial intelligenceSparse-view CT, training and inference
Download
Download centreAll software packagesDownload & installLicence, checksums and setup
Documentation
DocumentationAll documentationSoftware manualsUser guidesAPI guidePublic and maintainer APIsDownload & installChecksums and setupDAISY user docs ↗Framework and algorithms
NewsTeamAbout DAISYTORCH platform ↗
中文
DAISY Data Processing Software

Official site of HEPS DAISY data processing software: introductions, online access and downloads.

Navigation
  • Software
  • Download
  • Documentation
  • News
  • Team
  • About DAISY
  • Admin
Links
  • TORCH platform ↗
Institute of High Energy Physics, CAS · HEPS Big Data Centre
← Back to software
Diffraction

Daisy Batch Integrator

Desktop data processing for high-throughput scattering and diffraction at HEPS. SAXS/WAXS: it reads 2D/3D/4D HDF5 detector data, runs batch pyFAI azimuthal integration (1D / 2D / radial; 2θ, q and d), then overlays, background-subtracts, averages, merges and Guinier-analyses the curves. Powder diffraction: reference phases from CIF with ring prediction, peak detection and pseudo-Voigt fitting, search-match, unit-cell refinement, and in-situ Series with frame-by-frame peak tracking. Provenance is written into every export and session.
BeamlinesID08ID23
Download ↗
Daisy Batch Integrator screenshot

About this software

Daisy Batch Integrator is the offline data-processing desktop application for high-throughput scattering and diffraction experiments at HEPS (PyQt5 GUI). Integration is delegated to pyFAI: the application only prepares the frame (flips, mask, non-finite pixels, polarization validation) and hands it to pyFAI once, so the numbers are identical to calling pyFAI directly.

Capabilities

  • Input and geometry: 2D, 3D [frame,y,x] and 4D [frame,channel,y,x] HDF5, with lazy per-frame loading for large files; load or edit a PONI, masks (.npy, .edf, images), detector orientation 0–4, and call pyFAI-calib for interactive calibration.
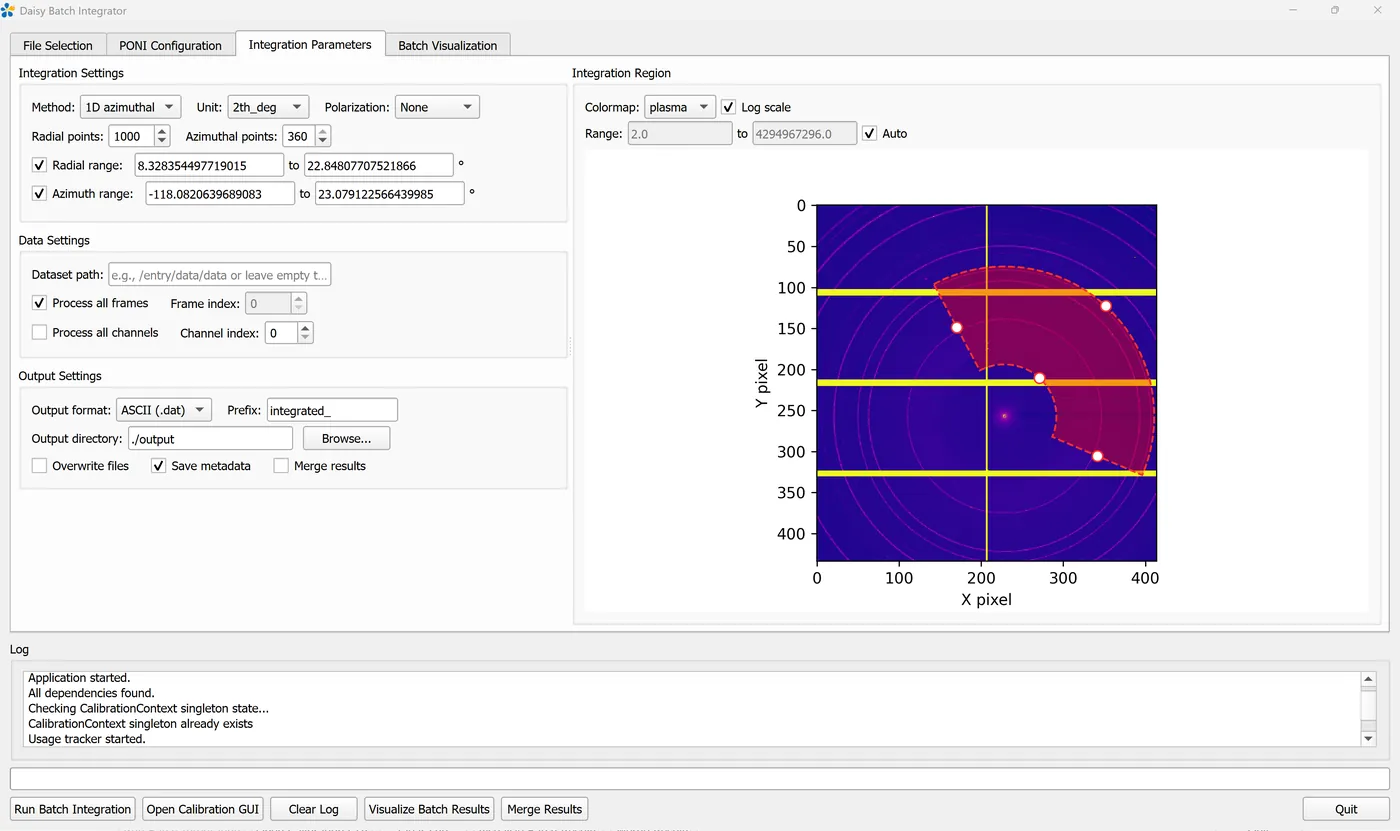
  • Batch integration: 1D azimuthal, 2D azimuthal and radial; units 2θ (deg/rad) and q (nm⁻¹/Å⁻¹), with d (nm/Å) offered as a display unit on the diffraction page (integrated in q, then converted); polarization, radial and azimuth ranges, .dat/.h5 output.
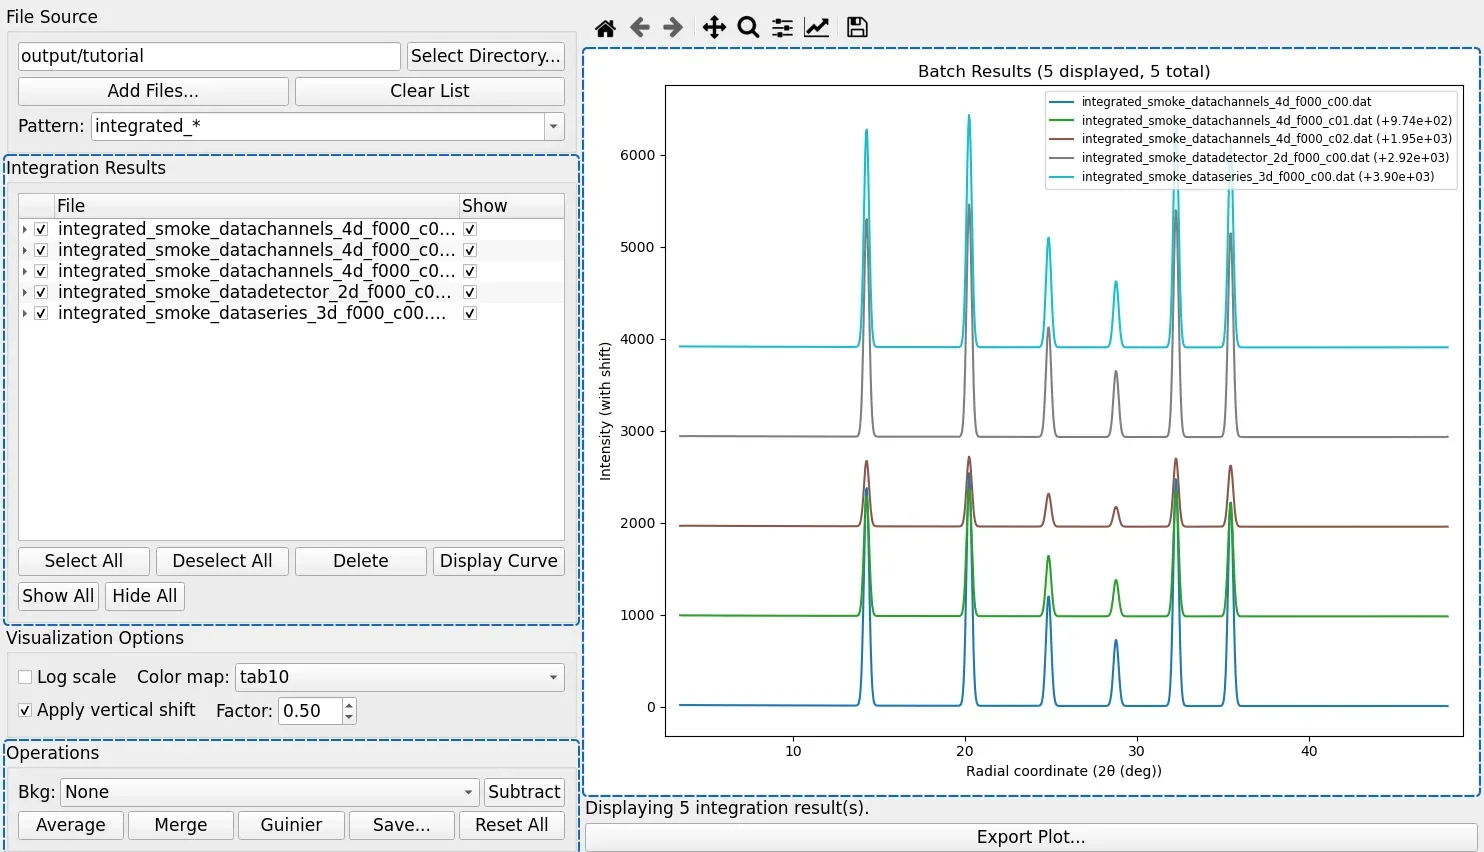
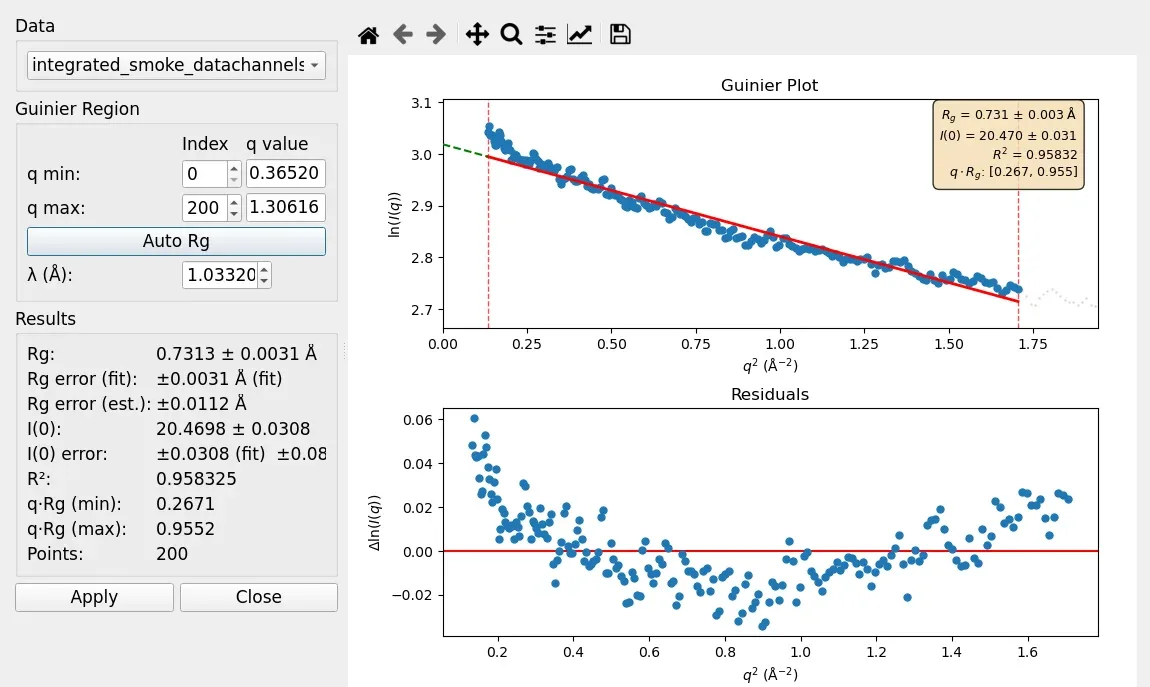
  • SAXS/WAXS processing: overlay curves, background subtraction, averaging, interactive two-curve merge, Guinier analysis, and per-curve scale/offset/q-crop.
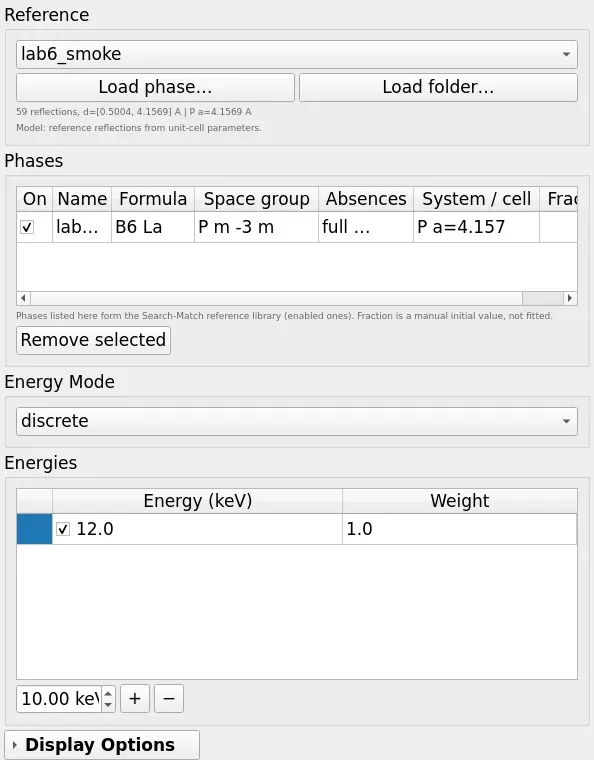
  • Powder diffraction: reference phases from CIF (all seven crystal systems, triclinic included) or built-in calibrants; full space-group systematic absences (gemmi ships with the package; a source install without it falls back to lattice centring); ring prediction and multi-energy / pink-beam visualization; peak detection and pseudo-Voigt fitting (single peak, or a joint fit of all peaks on a background thread that can be cancelled — a cancelled run is discarded); search-match (single-reference d-spacing matching, optionally with gemmi-computed relative intensities as a scoring aid); unit-cell refinement (lattice least squares on peak positions, optionally through GSAS-II for Le Bail/Rietveld, isolated in a subprocess and cancellable).
  • In-situ / time-resolved: Series over frames (heatmap, waterfall, peak tracking, per-frame batch analysis) with the frame index and provenance kept.
  • Export and record: .dat, .h5, TIFF, PNG/PDF/SVG plots; provenance (geometry, integration parameters, fit settings, software version) written into the files and the session; sessions can be saved and restored.
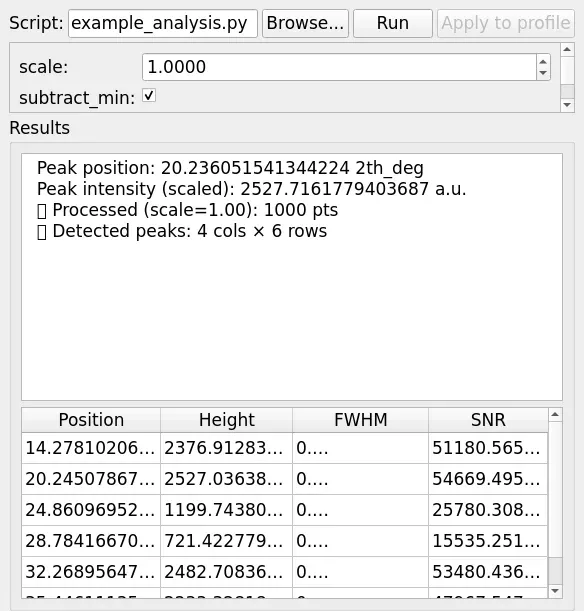
  • Extensible: an embedded Python analysis panel whose ctx exposes the current pattern and series, with results applicable back to the UI.

Workflow

File and frames → PONI / mask / calibration → batch integration → curve visualization and processing → (optional) diffraction analysis: reference phase → peak detection and fitting → search-match → unit-cell refinement → export and session.

Environment

Portable, no-install packages are provided for Windows 10/11 and Linux; running from source needs Python ≥ 3.11, PyQt5, pyFAI ≥ 2025.12.1, h5py, numpy, matplotlib and scipy. MIT licence. Boundaries: reference rings and sticks are a positional model (no structure factors or intensities), search-match structure-factor intensities are a scoring aid only, and unit-cell refinement is lattice least squares rather than Rietveld — the full boundary table is in the user guide.
Software interface

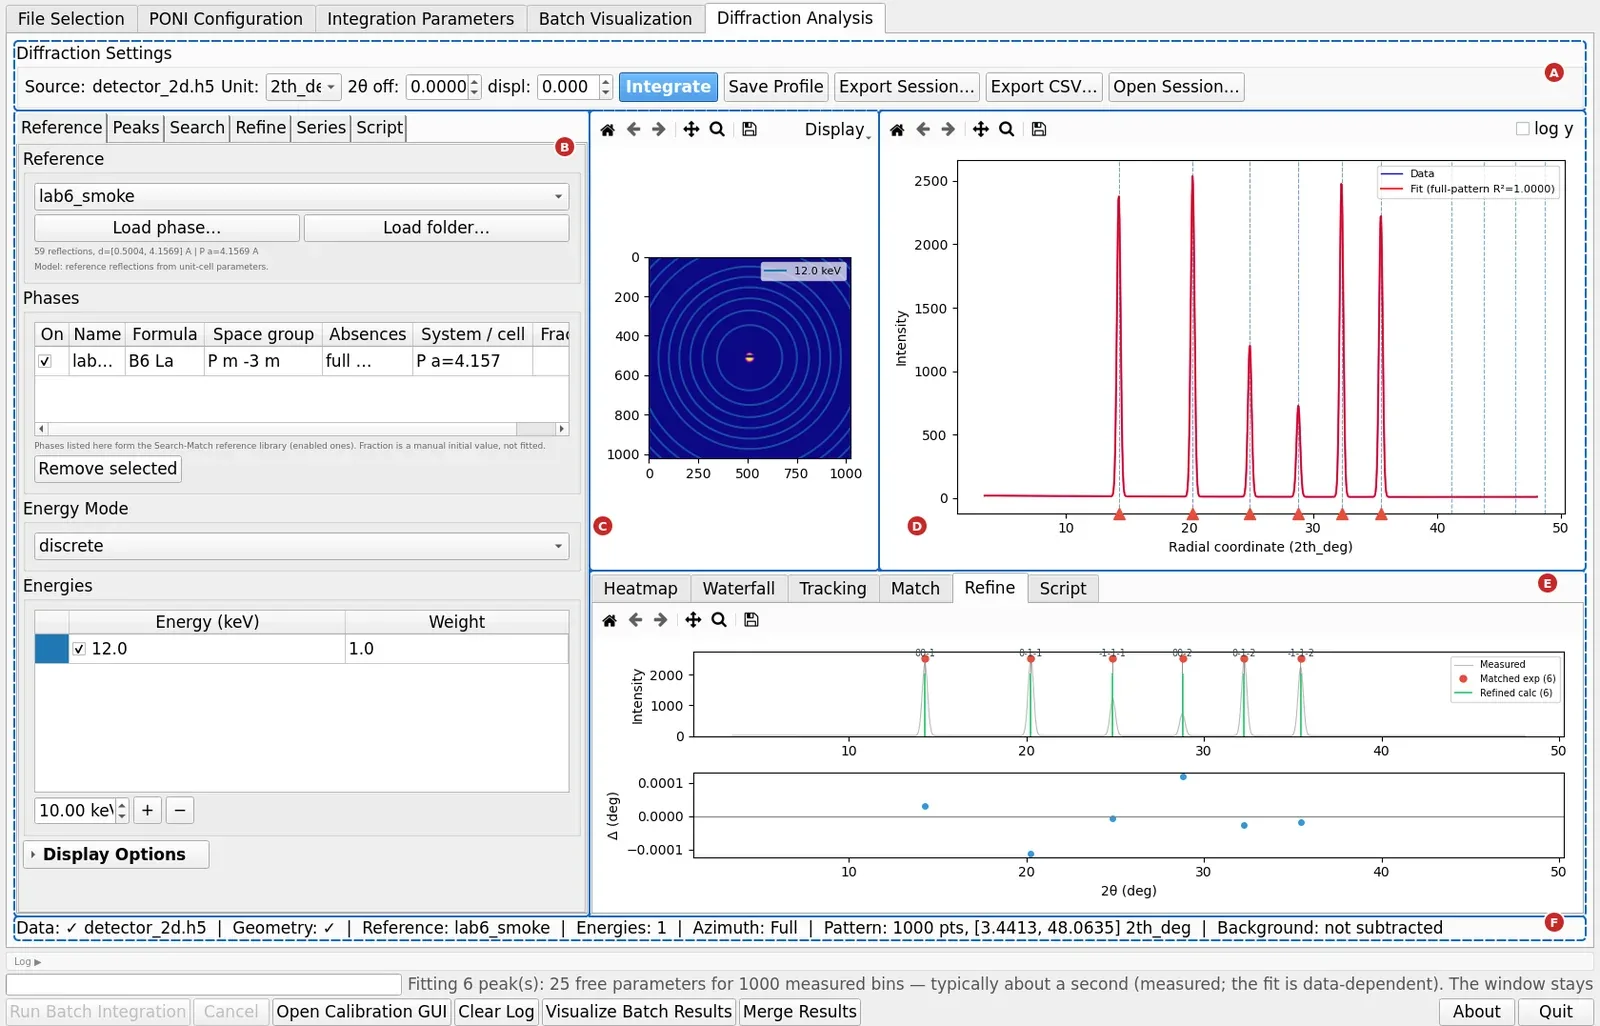
Diffraction workspace: parameter panel (A), workflow tabs (B), detector view (C), 1D profile (D), result plots (E) and the status row (F)
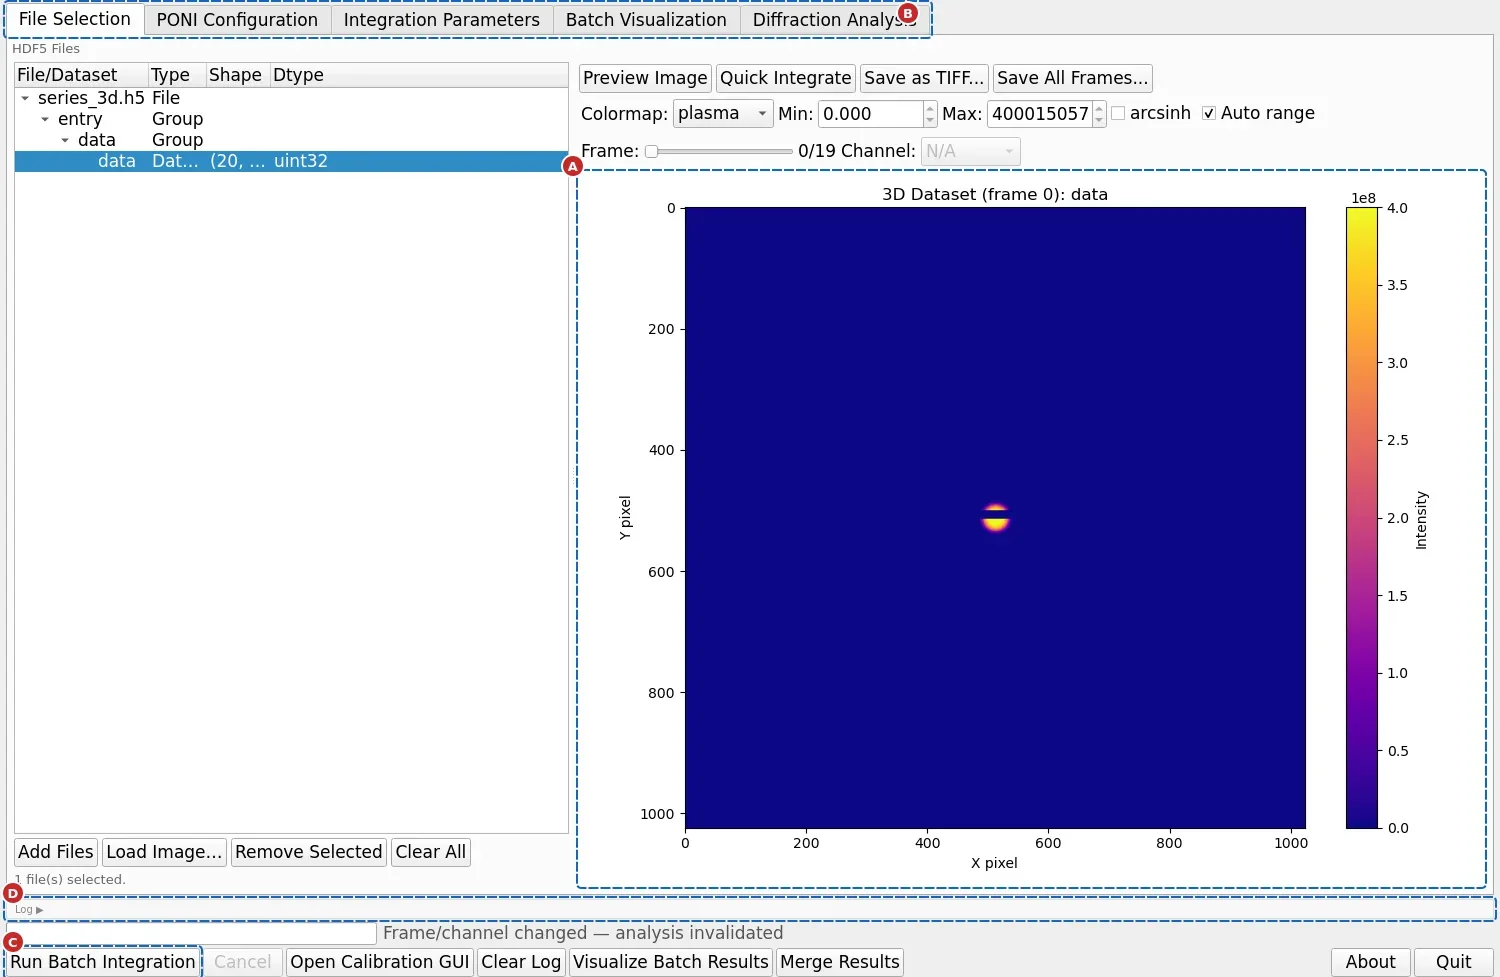
Main SAXS/WAXS window: file selection, PONI configuration, integration parameters and batch visualization
Reference tab: load a reference phase from CIF and predict its low-angle rings from the unit cell
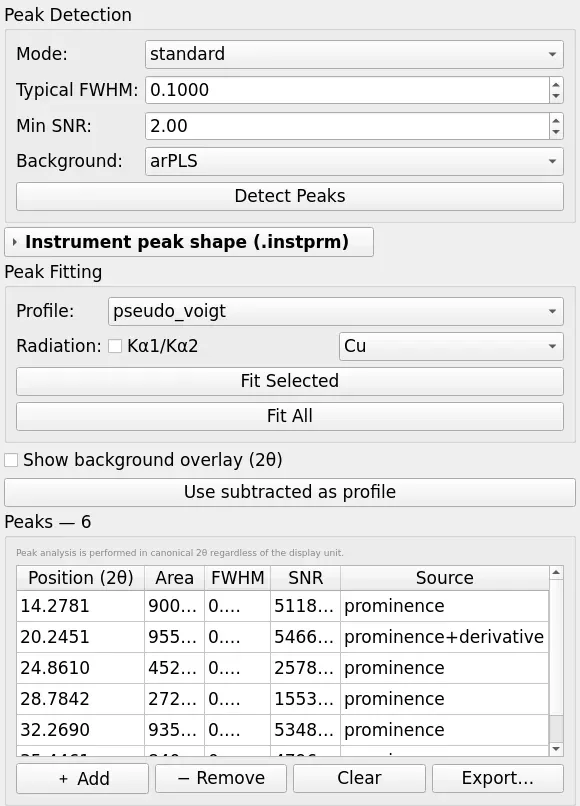
Peaks tab: peak detection, the peak table and pseudo-Voigt fitting (single peak or joint fit)

Features & algorithms

Batch integration, with pyFAI as the authority

2D/3D/4D HDF5 with lazy per-frame loading; 1D, 2D and radial methods in 2θ, q or d. The application only prepares the frame — binning is pyFAI's, so the numbers match a direct pyFAI call.

SAXS/WAXS curve processing

Overlay, background subtraction, averaging, an interactive two-curve merge, Guinier analysis, and per-curve scale/offset/q-crop.

Reference phases and ring prediction

Build a reference phase from a CIF (all seven crystal systems) or a built-in calibrant, predict its low-angle rings from the unit cell and overlay them on the measured profile; gemmi ships with the package for full space-group absences (glide/screw included).

Peak detection, fitting and search-match

Prominence-based detection plus pseudo-Voigt fitting, single peak or a joint fit of all peaks (background thread, cancellable, a cancelled run is discarded); match observed peaks to a reference phase by d-spacing and rank the candidates.

Unit-cell refinement

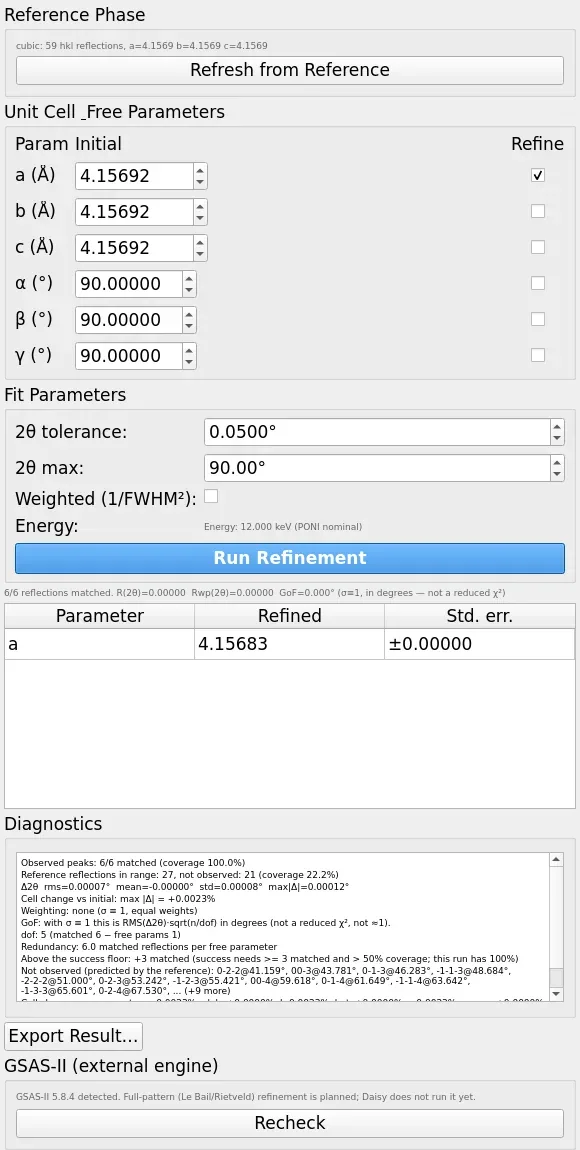
Lattice least squares on the matched peak positions, reporting refined values with uncertainties; optionally GSAS-II for Le Bail/Rietveld, isolated in a subprocess and cancellable.

In-situ series and peak tracking

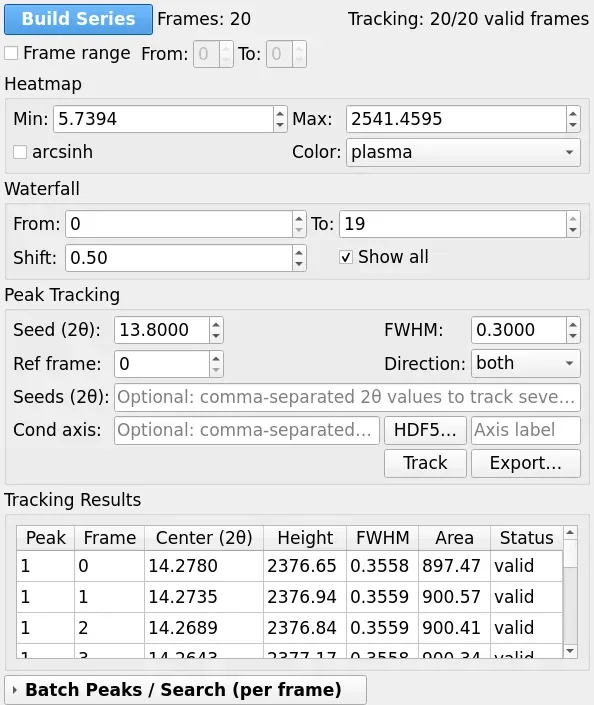
Build a Series from multi-frame or in-situ data: heatmap, waterfall, frame-by-frame peak tracking and batch analysis, with frame indices and provenance kept.

Record and export

.dat/.h5/TIFF plus PNG/PDF/SVG plots; geometry, integration parameters, fit settings and software version are written into the files and the session, which can be saved and restored.

Embedded Python analysis

Run Python analysis scripts inside the application: ctx exposes the current pattern and series, and results can be applied back to the UI or exported.

Documentation & manual

Online manualRead in the browser: installation, SAXS/WAXS workflow, beamstop-counter normalization, powder workflow and known boundaries→

Available versions

VersionPlatformFile sizePublishedDownloads
No package yet — use it online in TORCH.

Contacts

胡
胡誉Primary
huyu@ihep.ac.cn

Contact the maintainers above for usage, adaptation or customisation.
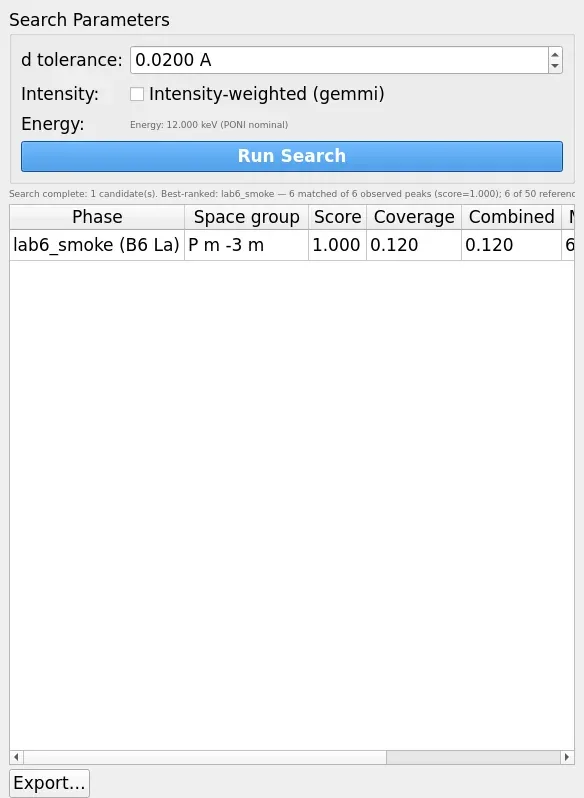
Search tab: match observed peaks to a reference phase by d-spacing and rank the candidates
Refine tab: lattice least-squares refinement on the matched peaks (optionally through GSAS-II)
Series tab: build an in-situ multi-frame series, analyse it frame by frame and keep the provenance
Script tab: run a Python analysis script against the current pattern or series and apply the result
Batch visualization: overlay curves, subtract background, average and merge two curves
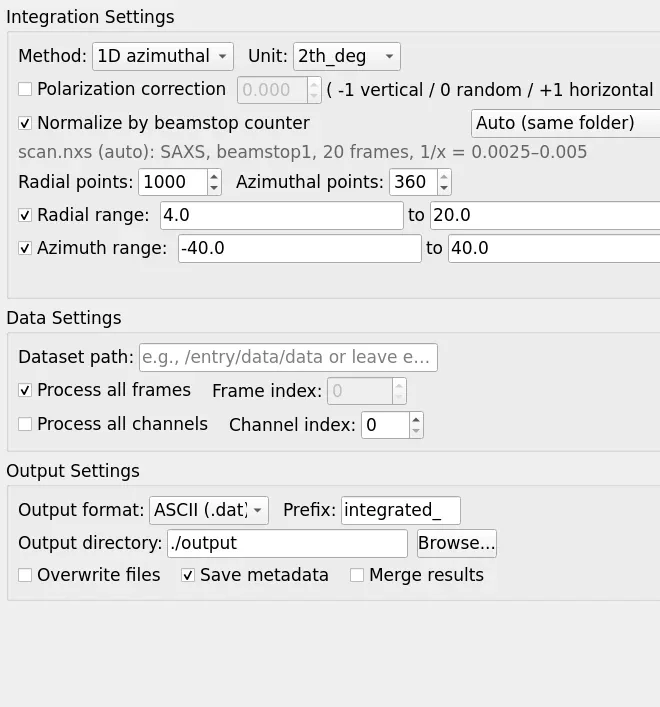
Integration parameters, including the beamstop-normalization switch: method and unit, polarization, radial and azimuthal ranges, output format and directory
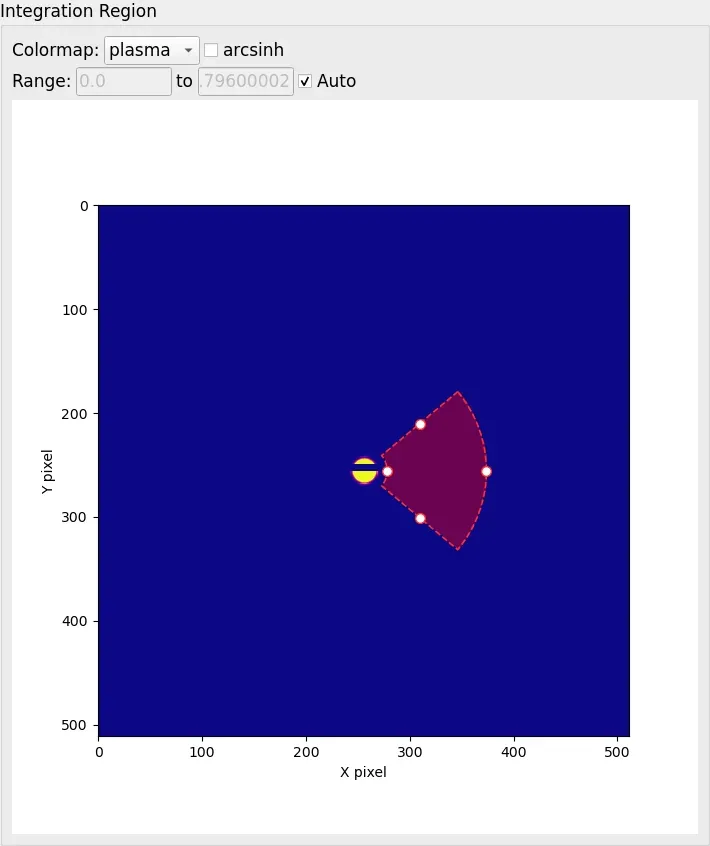
Visual region picker: drag a radial/azimuthal range on the detector image and the parameter fields follow
Guinier analysis: automatic window, Rg and I(0) with the fit quality