Synchrotron Data Analysis Software Platform
Software
All softwareBrowse the full catalogueImagingCT, Ptycho, BCDI, HoloDiffraction & scatteringPDF, SAXS, BMX, XPCSSpectroscopyXAS, XRF, XRS, PCA/LCFData toolsConversion, cropping and formatsArtificial intelligenceSparse-view CT, training and inference
Download
Download centreAll software packagesDownload & installLicence, checksums and setup
Documentation
DocumentationAll documentationSoftware manualsUser guidesAPI guidePublic and maintainer APIsDownload & installChecksums and setupDAISY user docs ↗Framework and algorithms
NewsTeamAbout DAISYTORCH platform ↗
中文
DAISY Data Processing Software

Official site of HEPS DAISY data processing software: introductions, online access and downloads.

Navigation
  • Software
  • Download
  • Documentation
  • News
  • Team
  • About DAISY
  • Admin
Links
  • TORCH platform ↗
Institute of High Energy Physics, CAS · HEPS Big Data Centre
← Back to software
Imaging

Daisy Large Image Viewer

Tile-streamed viewer and analysis tool for very large 2D scientific images without loading the full image into memory, with display enhancement, ROI measurements, comparison, histograms, line profiles and export.
BeamlinesID21
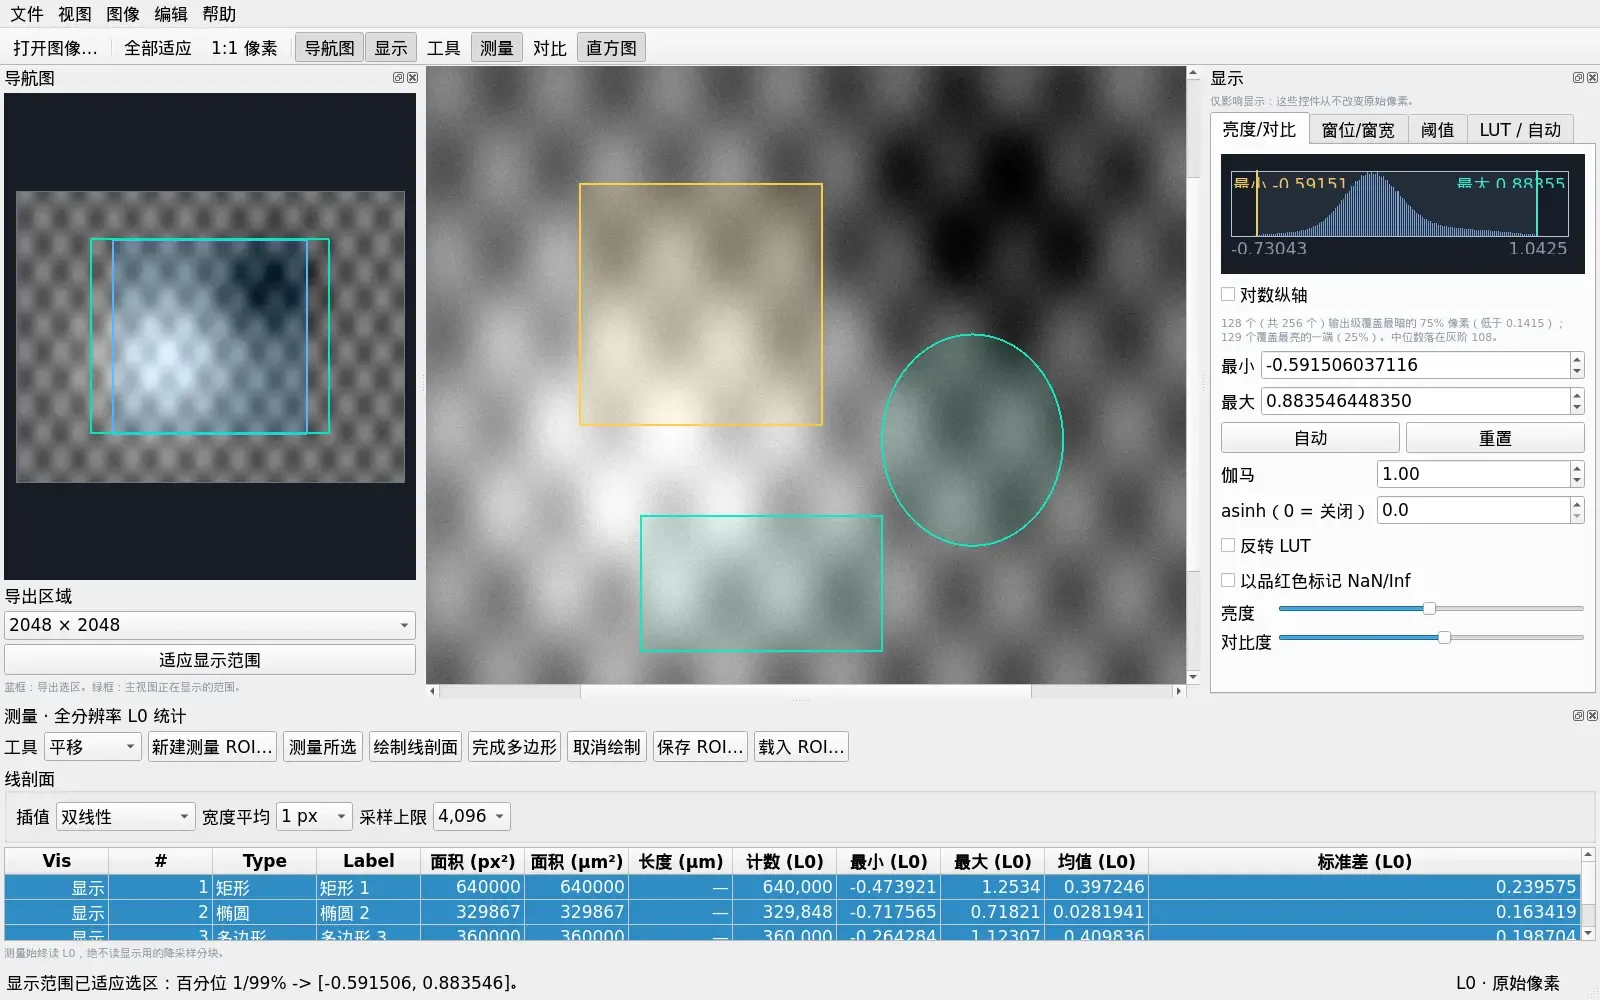
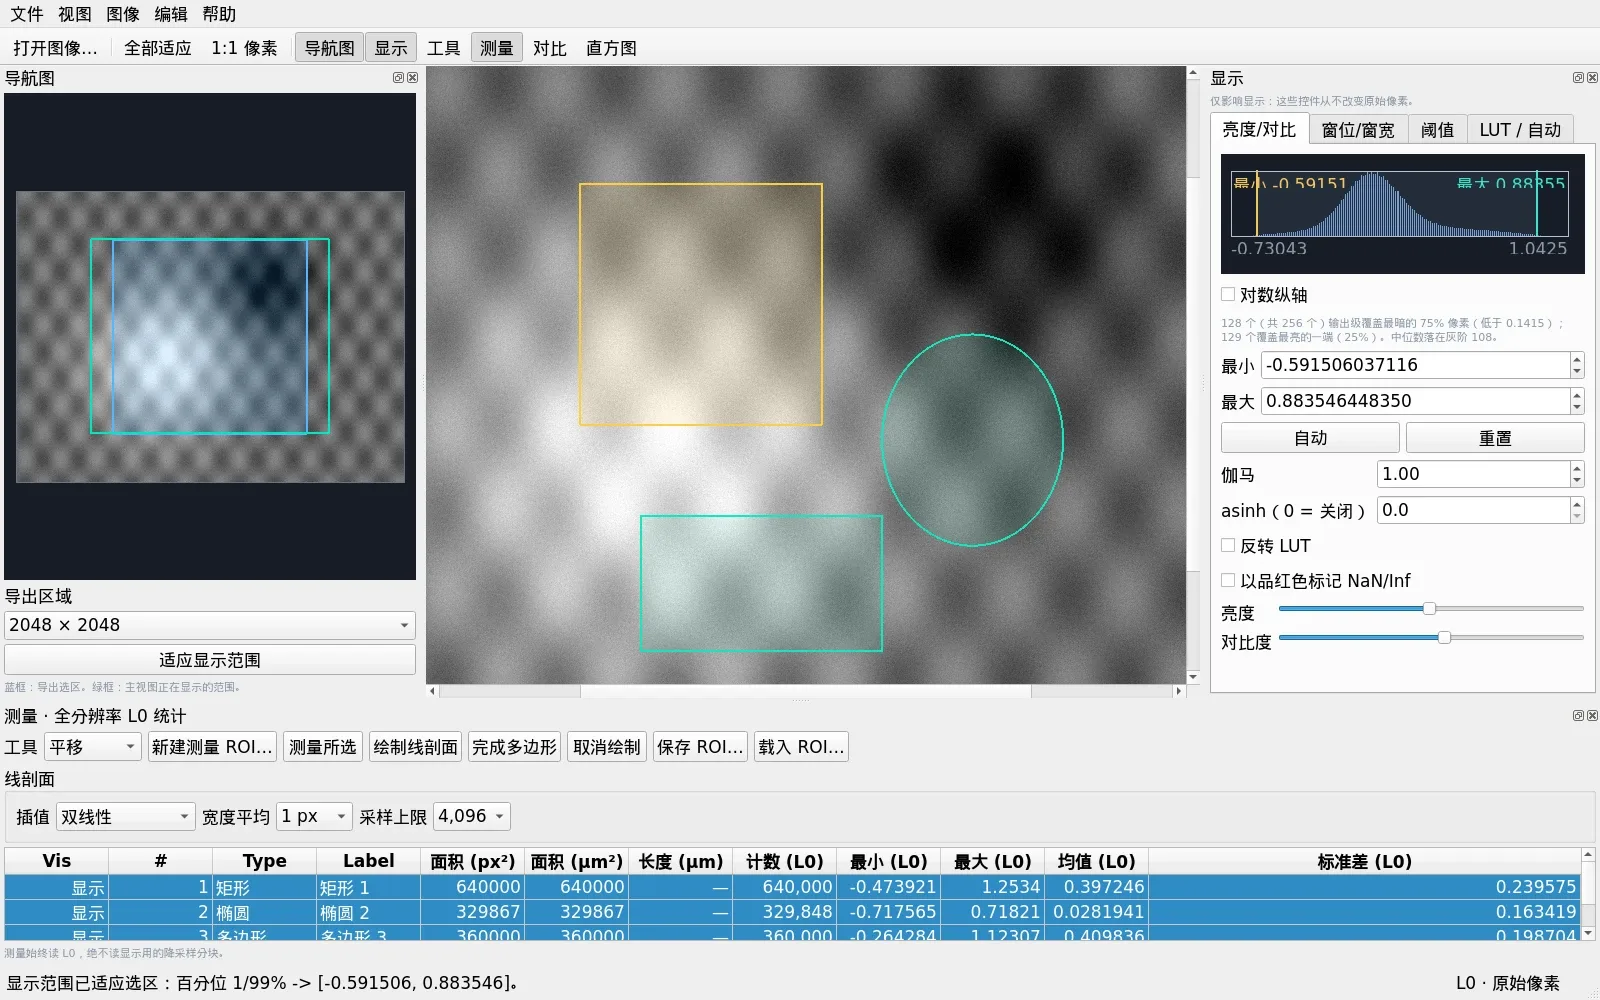
Daisy Large Image Viewer screenshot

About this software

Daisy Large Image Viewer (interface version 0.10.1) is designed for very large 2D scientific images. The image remains on disk and only visible tiles are read on demand, allowing files much larger than memory to be browsed interactively. It has been validated on a real ID21 mosaic of 131,641 × 170,178 pixels and approximately 83.5 GiB.
Core capabilities

  • Tile- and pyramid-based display without loading the entire image into memory
  • Display enhancement, window/level, threshold, LUT, gamma and auto range affect display pixels only
  • Supports TIFF, BigTIFF, OME-TIFF, HDF5 / NeXus, BigDataViewer XML and OME-Zarr
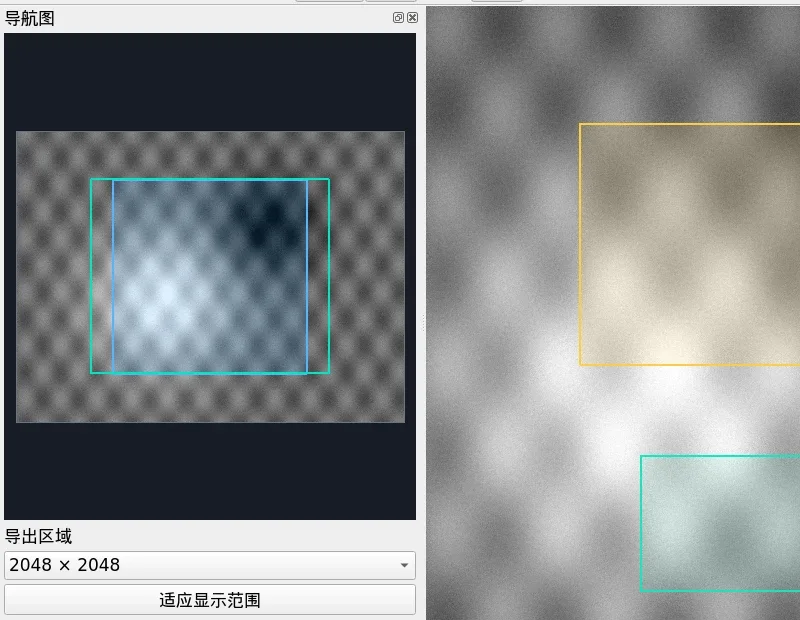
  • Navigator, precise export selection, current viewport and 1:1 native-pixel inspection
  • Rectangle, ellipse, polygon, freehand, line and polyline ROIs

Measurement and analysis

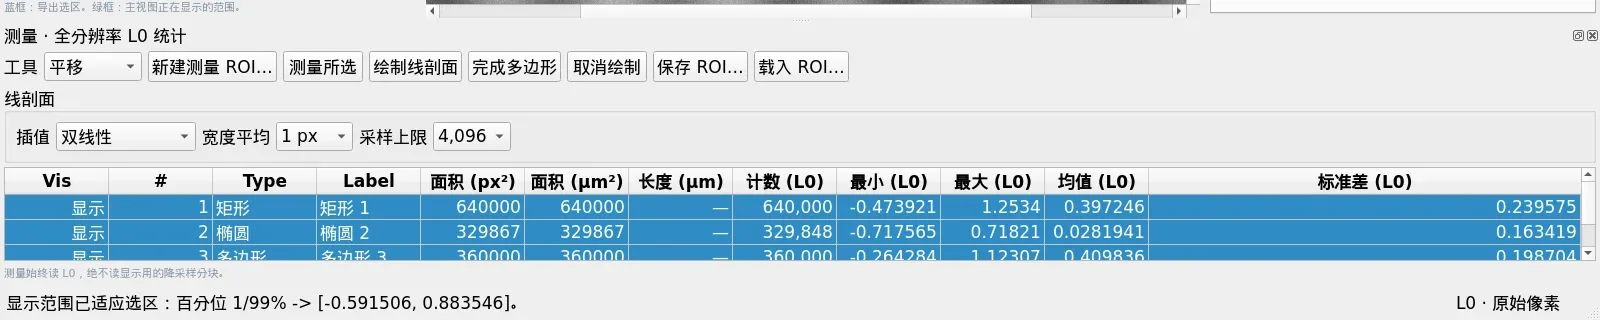
  • ROI measurements always read native L0 data, independent of display downsampling
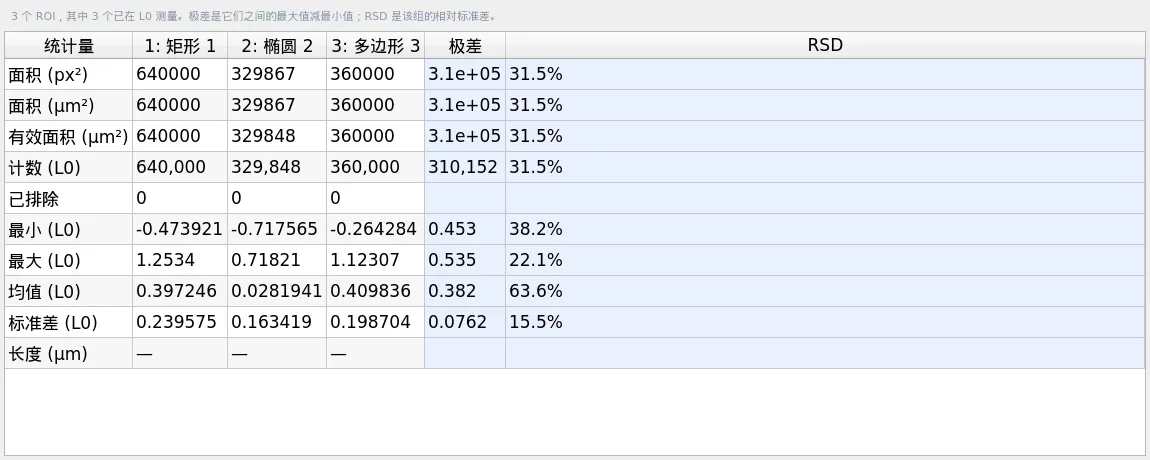
  • Area, count, minimum, maximum, mean and standard deviation
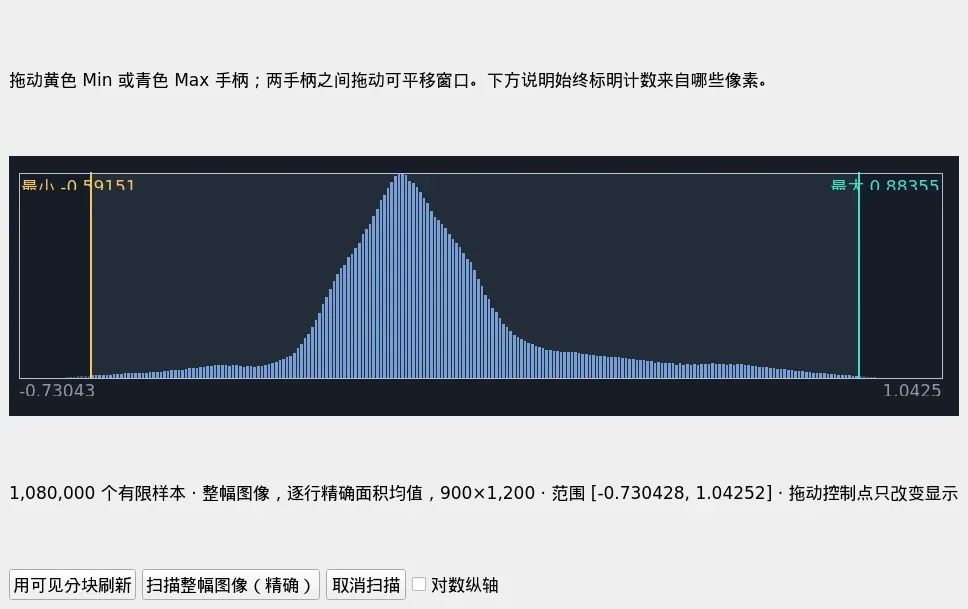
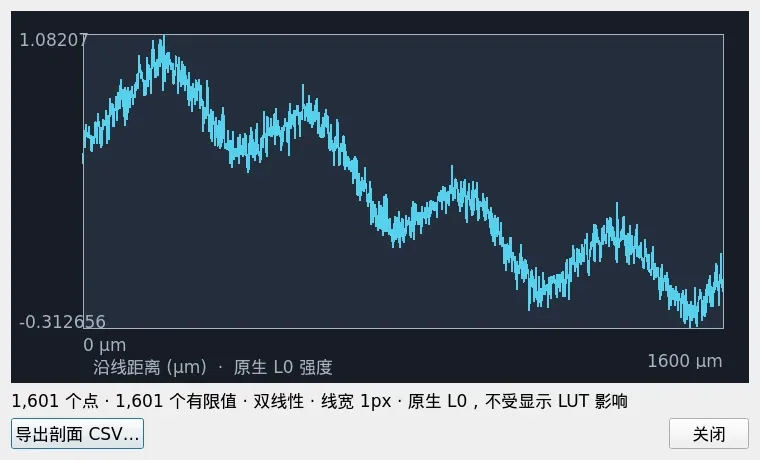
  • Multi-ROI comparison, spread, relative standard deviation, histograms and line profiles
  • Export measurement CSV, comparison CSV, ROI masks, native ROI TIFF, adjusted PNG and session files

Long tasks and scope

  • Exact overview construction and statistics scans show progress, ETA and cancellation
  • Chinese and English interface switching
  • Currently supports single 2D grayscale images; RGB, multichannel, 3D and time-series data are not supported

Software interface

Full main window: navigator, canvas, Display and Measurements (synthetic demo data)
Measurements: L0 ROI area, count and intensity statistics
Multiple ROIs compared with Spread and RSD
Interactive histogram: drag Min/Max handles to adjust the display window
Line profile: native L0 sampling and physical distance axis

Features & algorithms

Streaming access to huge images

Reads image tiles on demand without loading the full image into memory.

Multi-format support

TIFF, BigTIFF, OME-TIFF, HDF5 / NeXus, BigDataViewer XML and OME-Zarr.

Display changes never alter data

Brightness, contrast, window/level, threshold and LUT affect display only.

Native-resolution measurements

ROI area and intensity statistics always read L0 data, independent of downsampling and display settings.

Comparison and profile analysis

Multi-ROI comparison, histograms, line profiles and CSV/TIFF/PNG export.

Visible long-task feedback

Exact overviews and full-image scans show progress, ETA and safe cancellation.

Documentation & manual

Online user guideRead the guide to opening images, navigation, display, measurements, comparison, histograms, export and shortcuts.→

Contacts

胡
胡誉Primary
huyu@ihep.ac.cn

Contact the maintainers above for usage, adaptation or customisation.
Line profile: native L0 sampling and physical distance axis
2048² export selection and canvas detail (synthetic demo data)