Synchrotron Data Analysis Software Platform
Software
All softwareBrowse the full catalogueImagingCT, Ptycho, BCDI, HoloDiffraction & scatteringPDF, SAXS, BMX, XPCSSpectroscopyXAS, XRF, XRS, PCA/LCFData toolsConversion, cropping and formatsArtificial intelligenceSparse-view CT, training and inference
Download
Download centreAll software packagesDownload & installLicence, checksums and setup
Documentation
DocumentationAll documentationSoftware manualsUser guidesAPI guidePublic and maintainer APIsDownload & installChecksums and setupDAISY user docs ↗Framework and algorithms
NewsTeamAbout DAISYTORCH platform ↗
中文
DAISY Data Processing Software

Official site of HEPS DAISY data processing software: introductions, online access and downloads.

Navigation
  • Software
  • Download
  • Documentation
  • News
  • Team
  • About DAISY
  • Admin
Links
  • TORCH platform ↗
Institute of High Energy Physics, CAS · HEPS Big Data Centre
← Back to software
Spectroscopy

Daisy-XRS

Desktop data processing software for X-ray Raman scattering (XRS) experiments (program name XRSProcessTool): loads elastic-peak and XRS scans, locates ROIs on 2D detector images, fits elastic peaks with a Lorentzian and rejects bad crystals, computes the momentum transfer q for ROI selection, and interpolates scans and ROIs into a final energy-transfer spectrum. Supports both legacy and new DAQ data layouts at B5 beamline (ID33).
BeamlinesID33
Open in TORCH ↗
Daisy-XRS screenshot

About this software

XRSProcessTool is a desktop application for X-ray Raman scattering (XRS) data processing at the B5 beamline (default data directory /heps/beamline/ID33). It turns raw scans into a final energy-transfer spectrum step by step.

Workflow

  1. Load data: read elastic-peak and XRS scans in .nxs format, supporting the legacy layout (entry/data/data external links), dual detectors (lambda + minipix) and the new DAQ layout where the 3D image dataset sits directly under entry/data (e.g. D_LAMBDA). Files can be picked individually or loaded by scan ID.
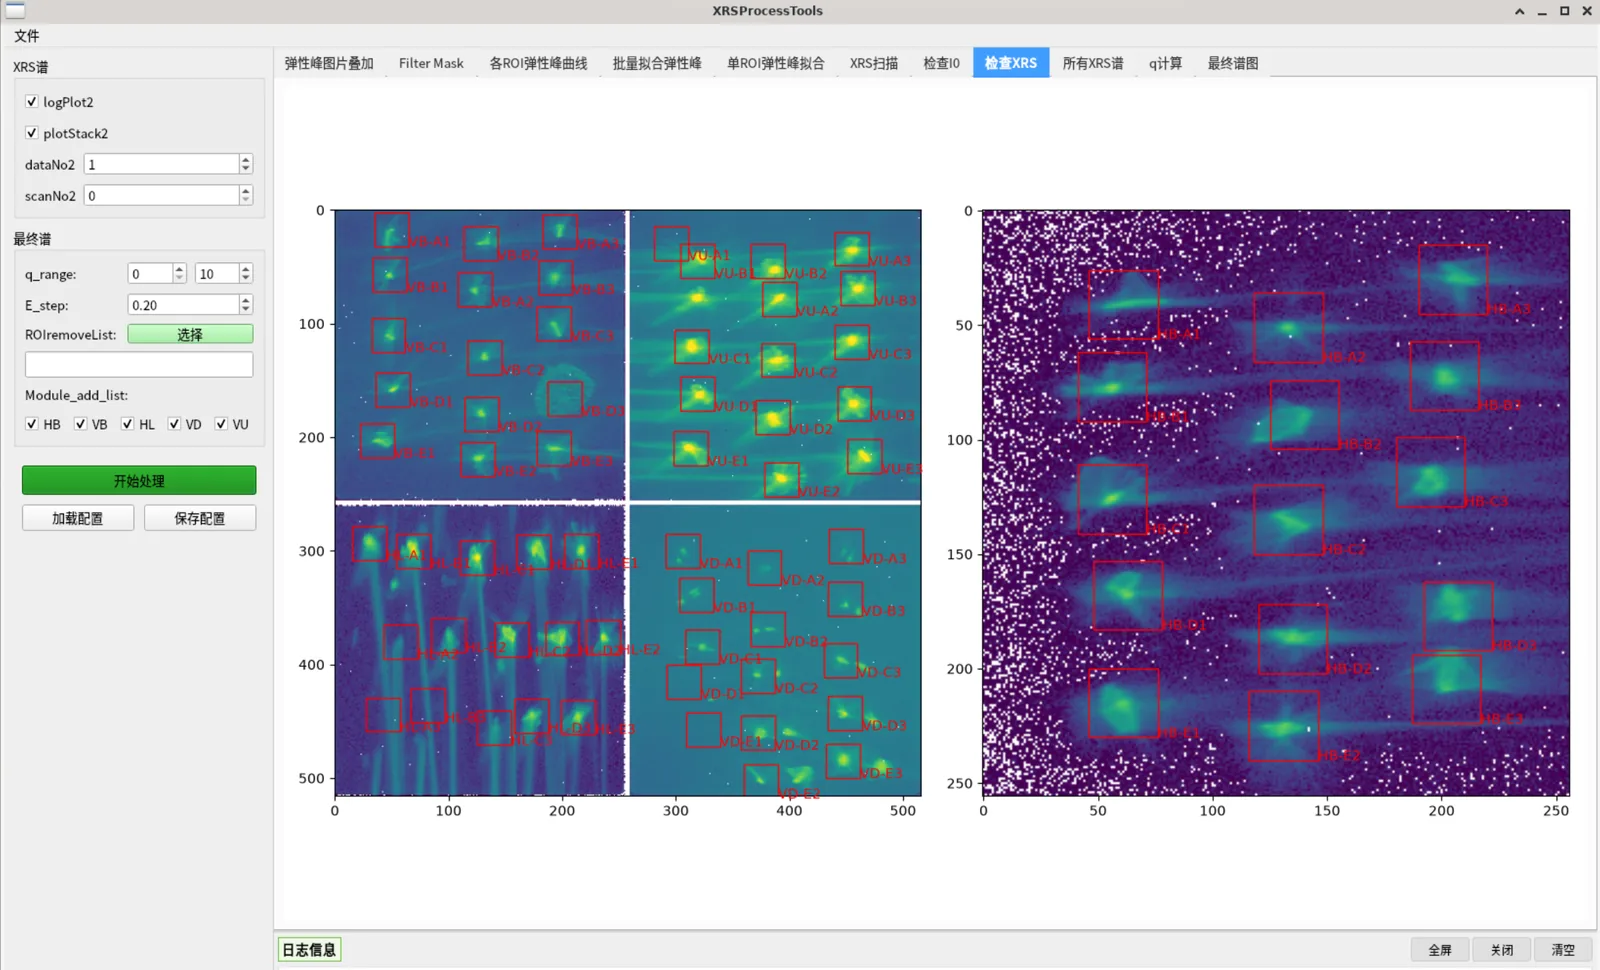
  2. ROI positioning: overlay crystal ROIs on the 2D detector image, drag to adjust, auto-centre on the brightest pixel, and build an intensity mask with a configurable threshold.
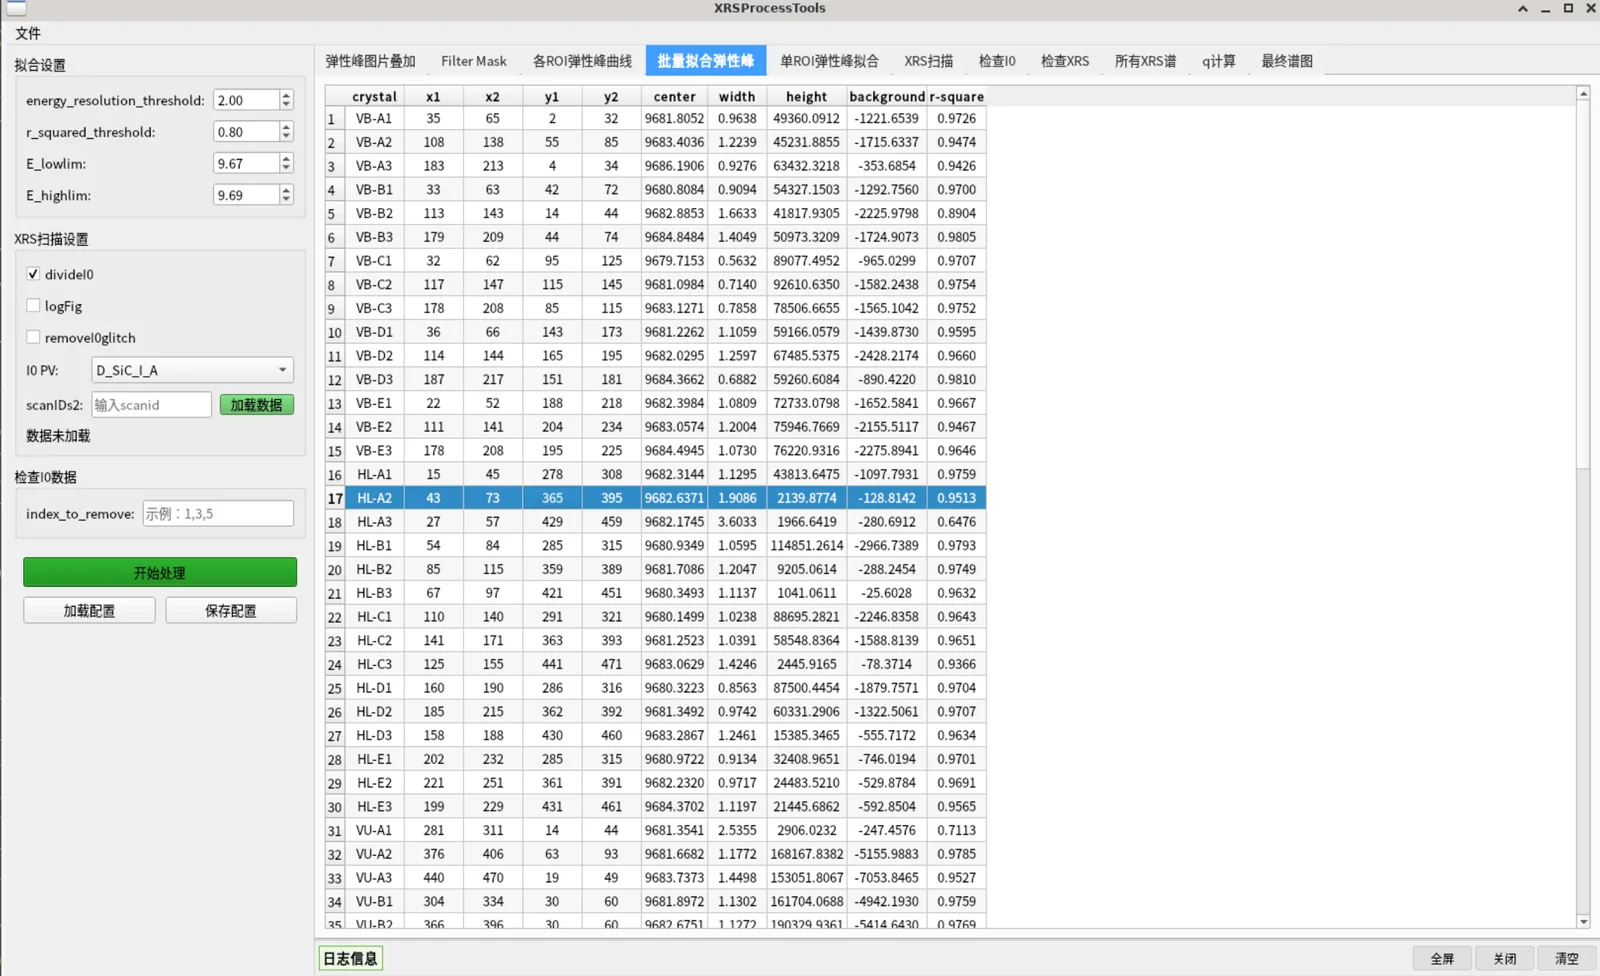
  3. Elastic peak fitting: fit each ROI with a Lorentzian and report centre energy, FWHM, height, background and R²; crystals failing the quality thresholds (low R², centre out of range, negative amplitude, excessive FWHM) are collected into a bad-fit list and excluded from the final spectrum.
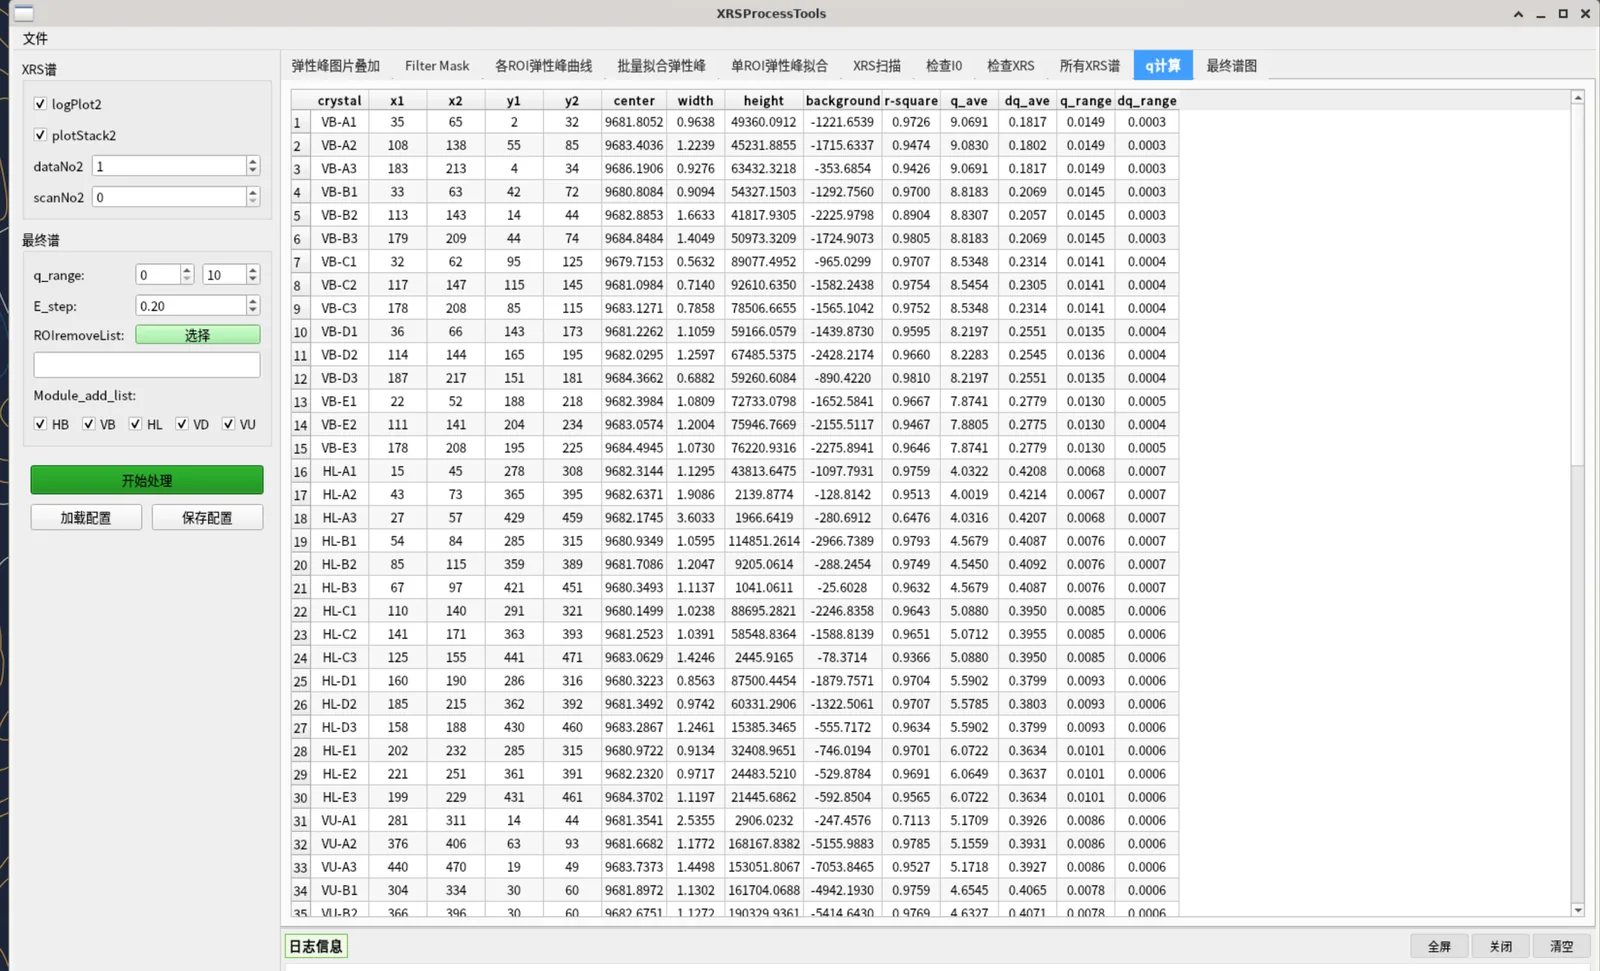
  4. Momentum transfer q: compute q from the fixed scattering angles of each module and the elastic peak energy, then select ROIs by a q range.
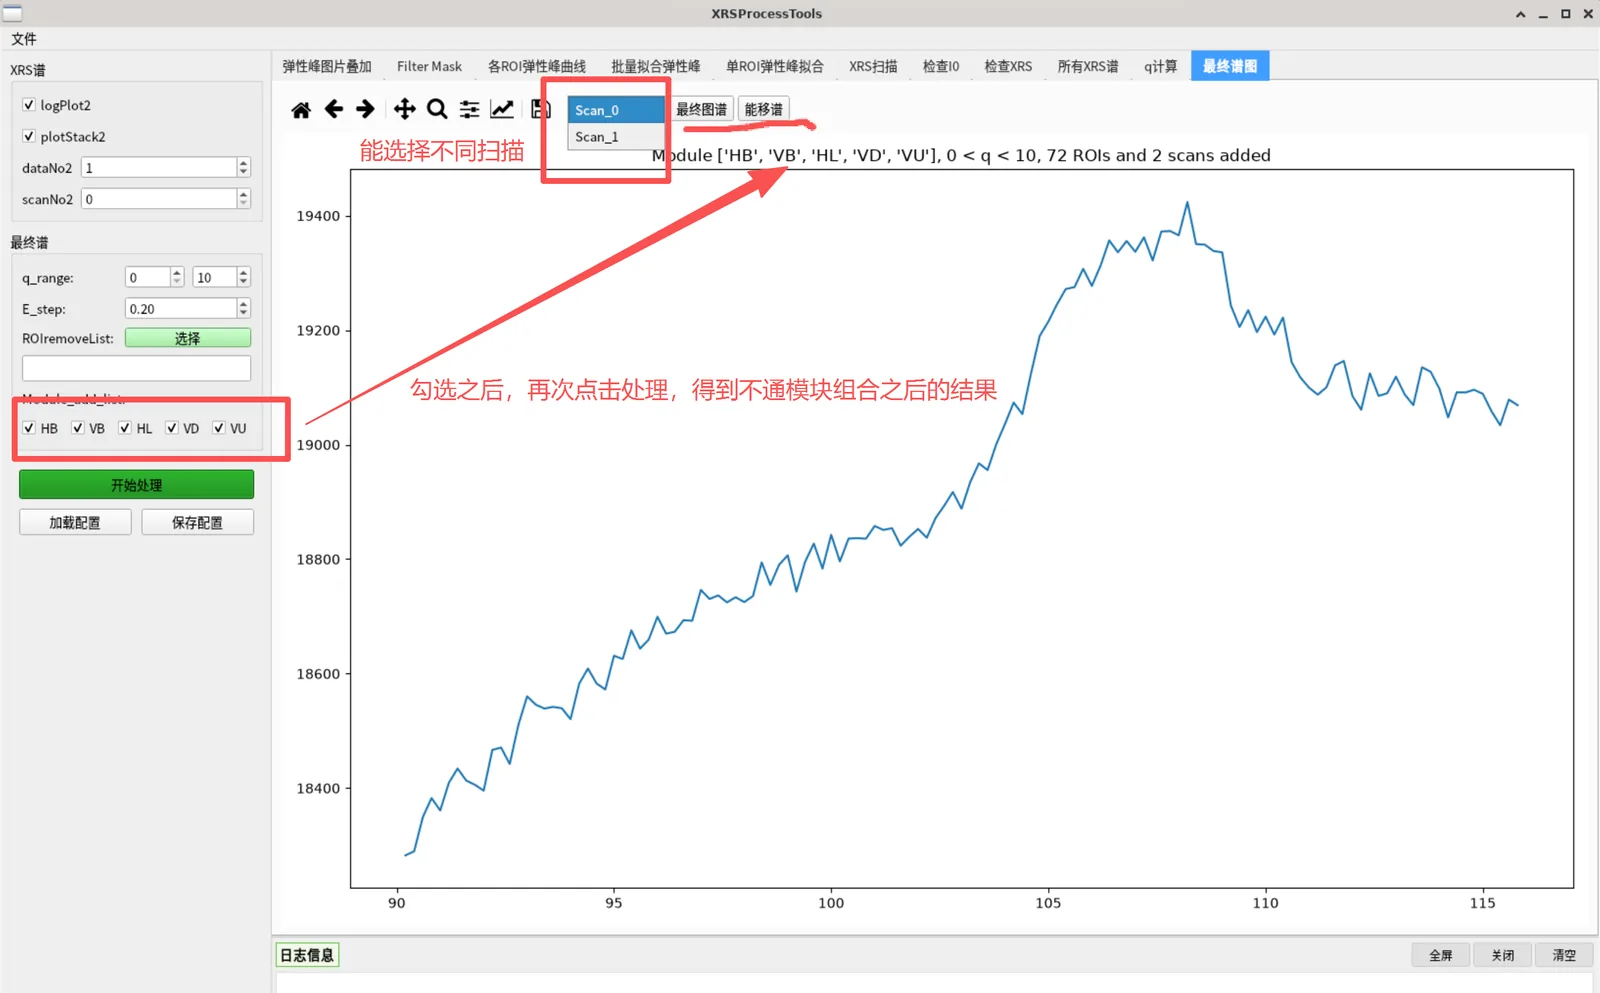
  5. Final spectrum: interpolate and stack scans and ROIs onto a common energy grid, with module selection and manual ROI exclusion, producing the energy-transfer spectrum and per-scan sub-plots.
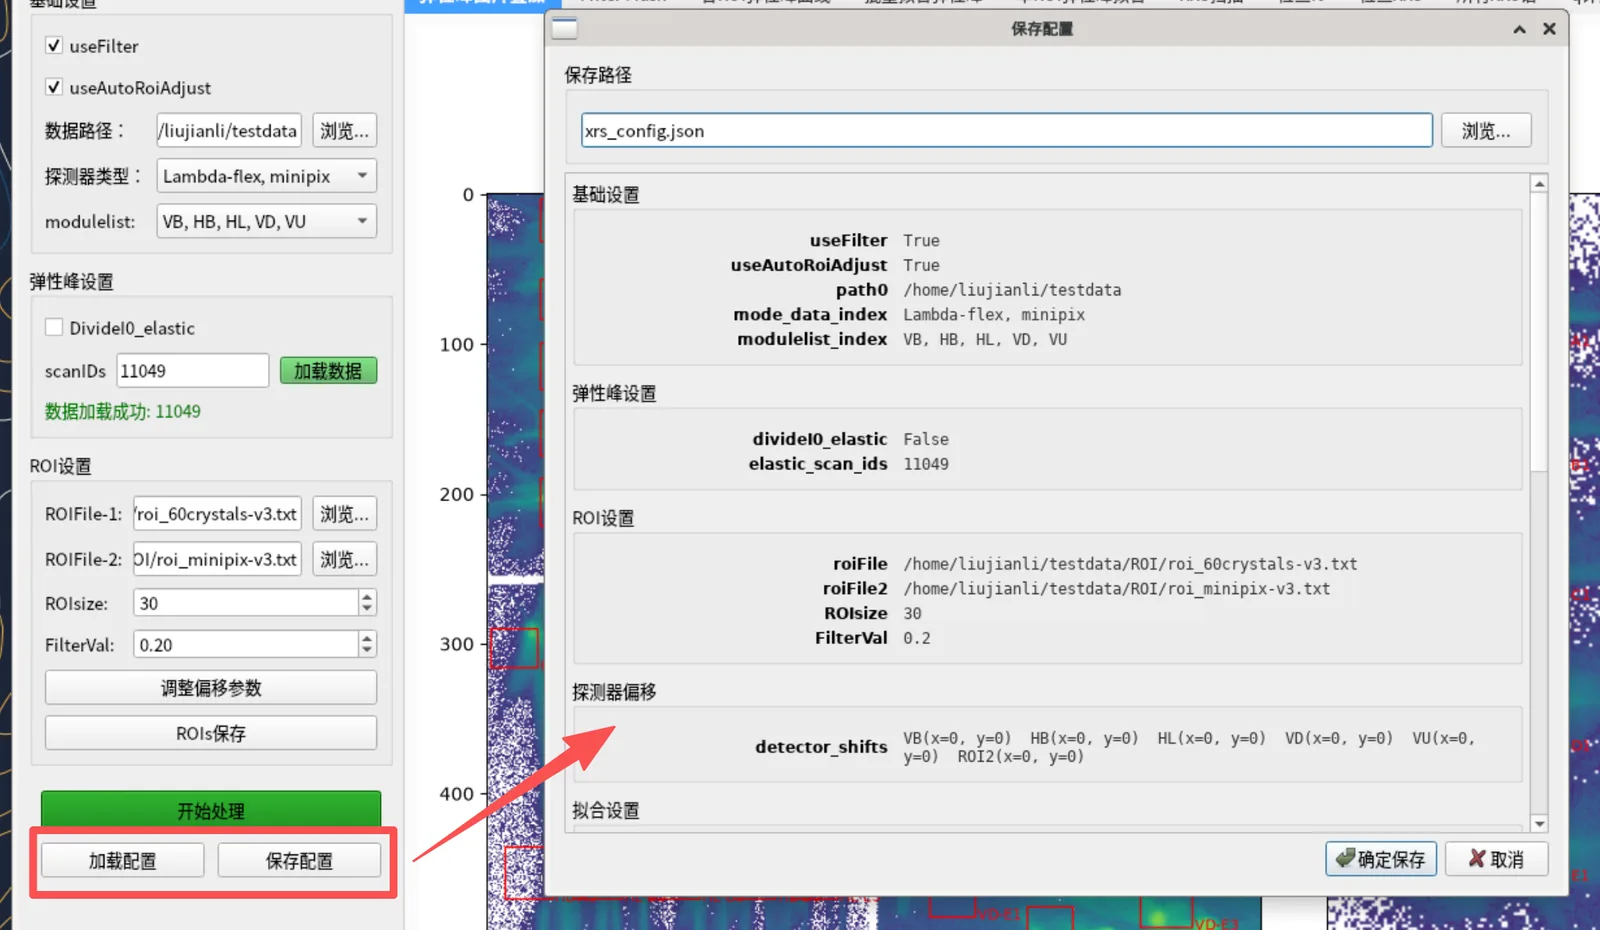
  6. Results and configuration: export results in merged / per-module / per-crystal modes together with fit results and a record of all parameters; save and reload parameters as JSON; usage statistics are recorded.

Runtime

  • Desktop package XRSProcessTool for Windows and Linux, with bundled CJK fonts; libgcc_s is deliberately not bundled to avoid conflicts with system libraries.
  • Online: available on the TORCH platform (link above).
  • From source: python main.py; dependencies are listed in requirements.txt.
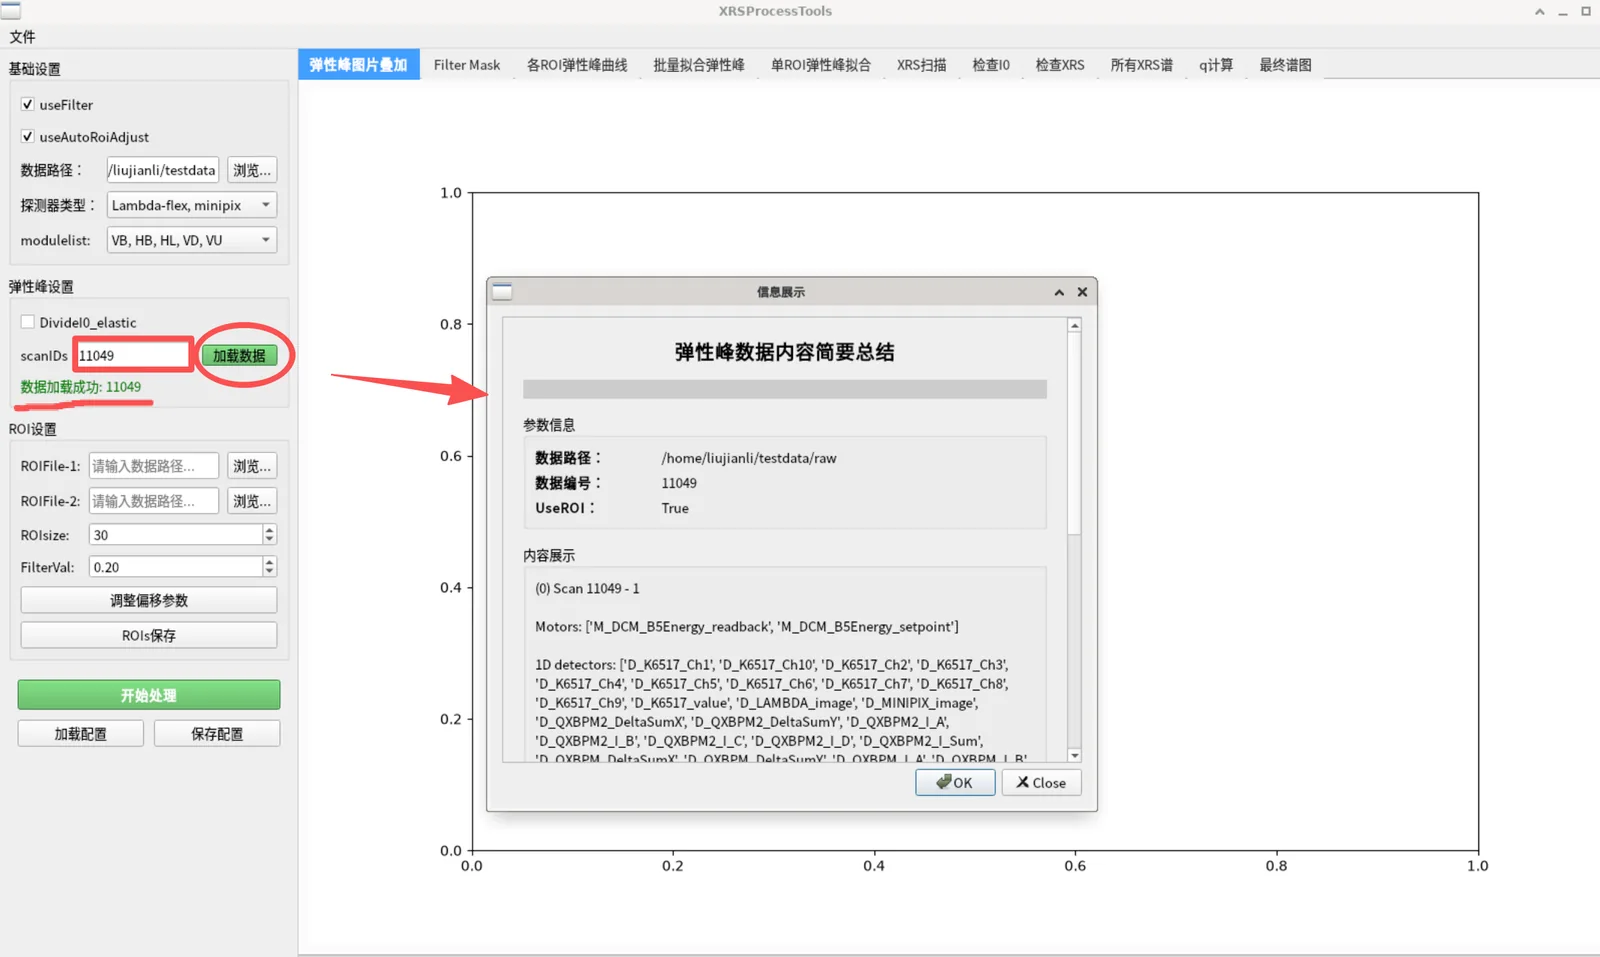
Software interface

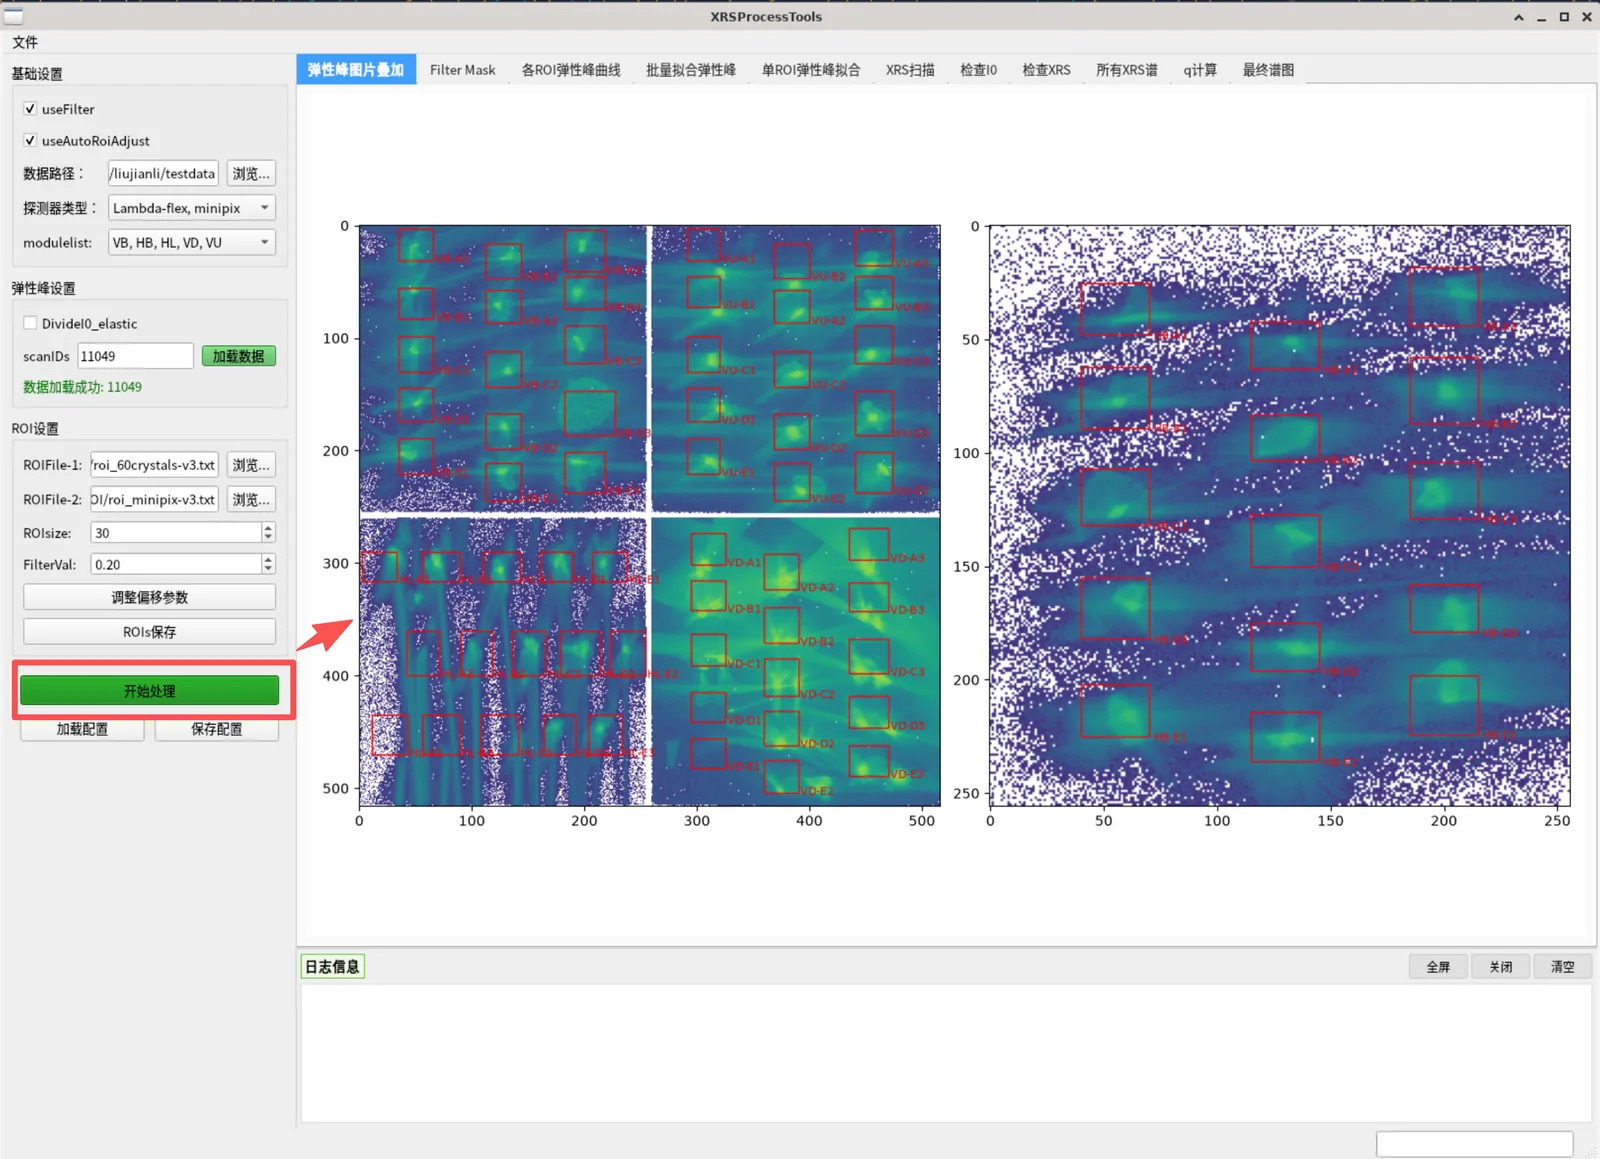
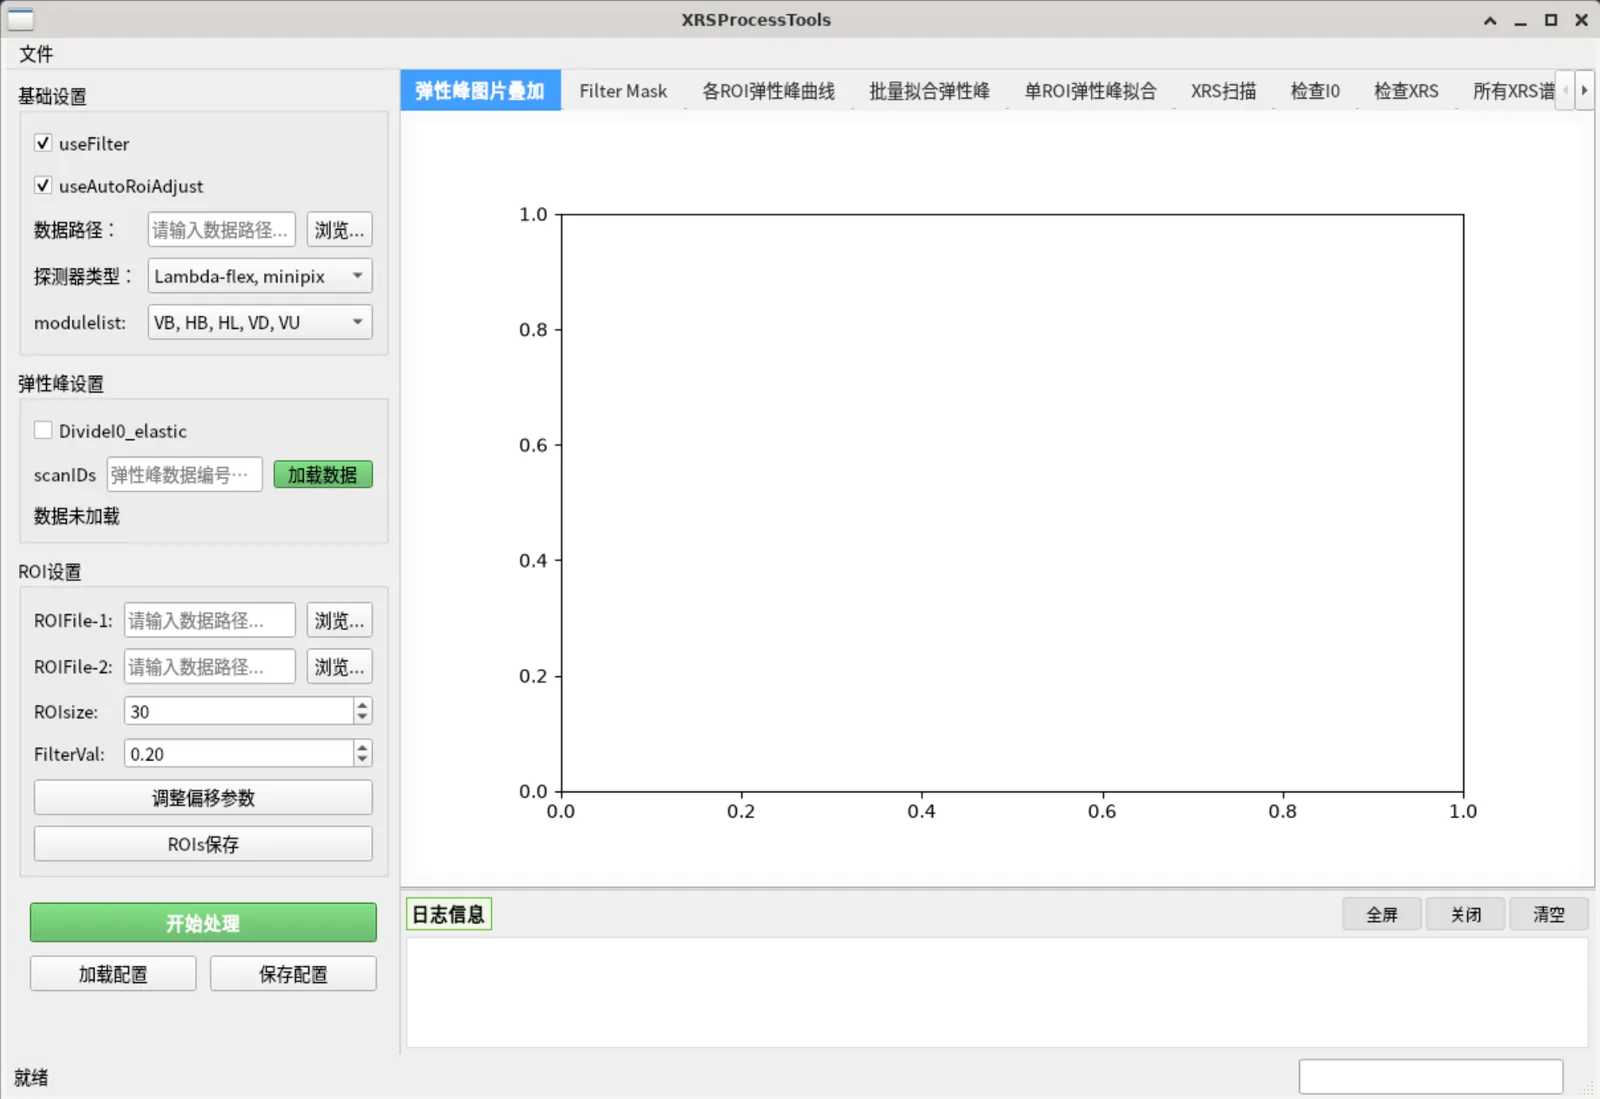
Main window: parameter panel on the left, 11 workflow tabs on the right, log panel below
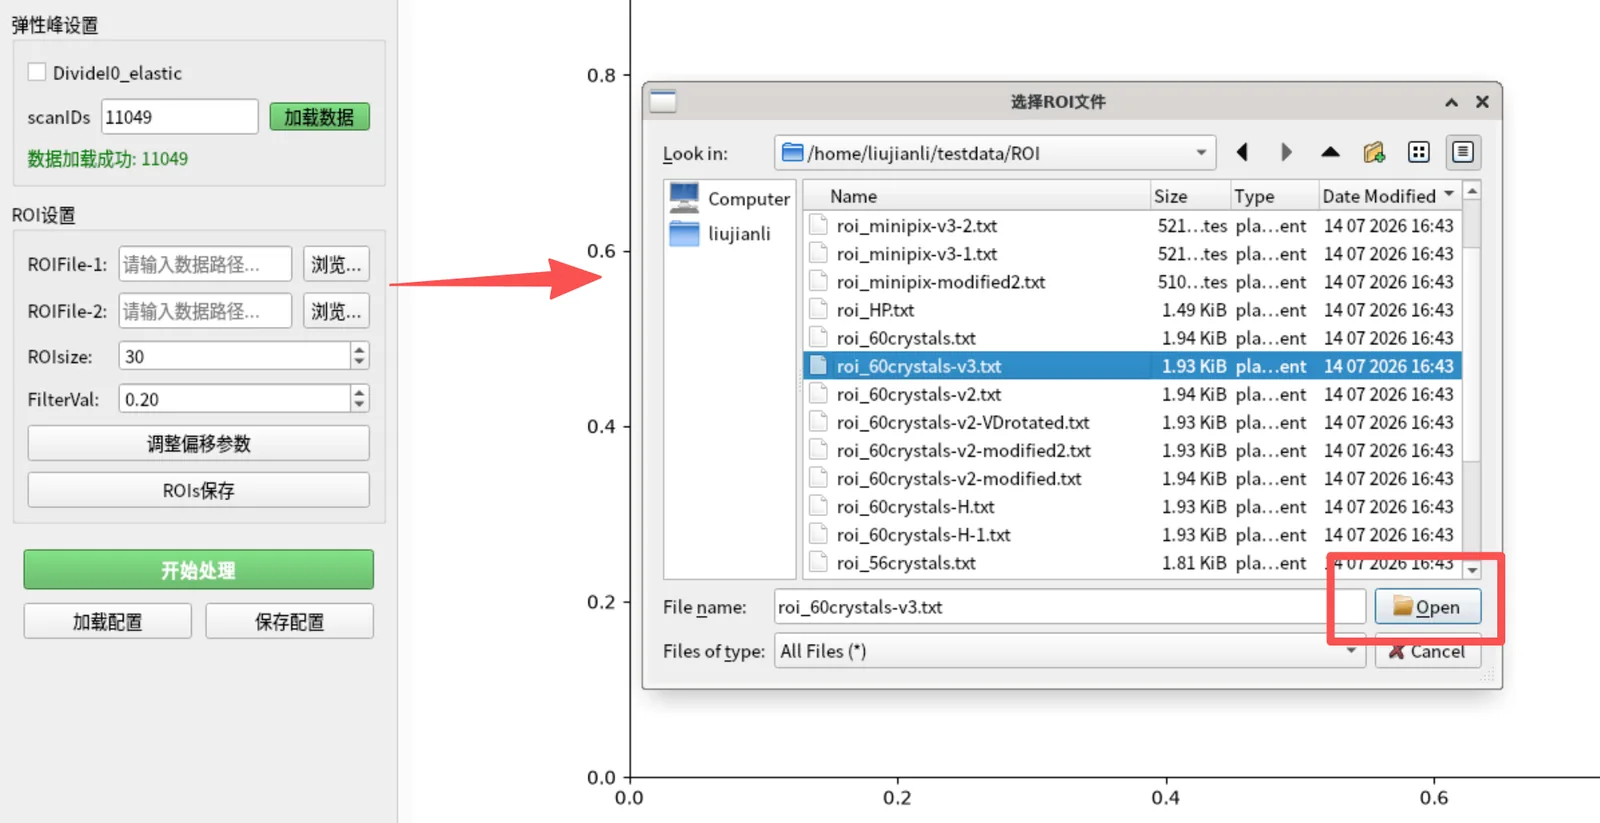
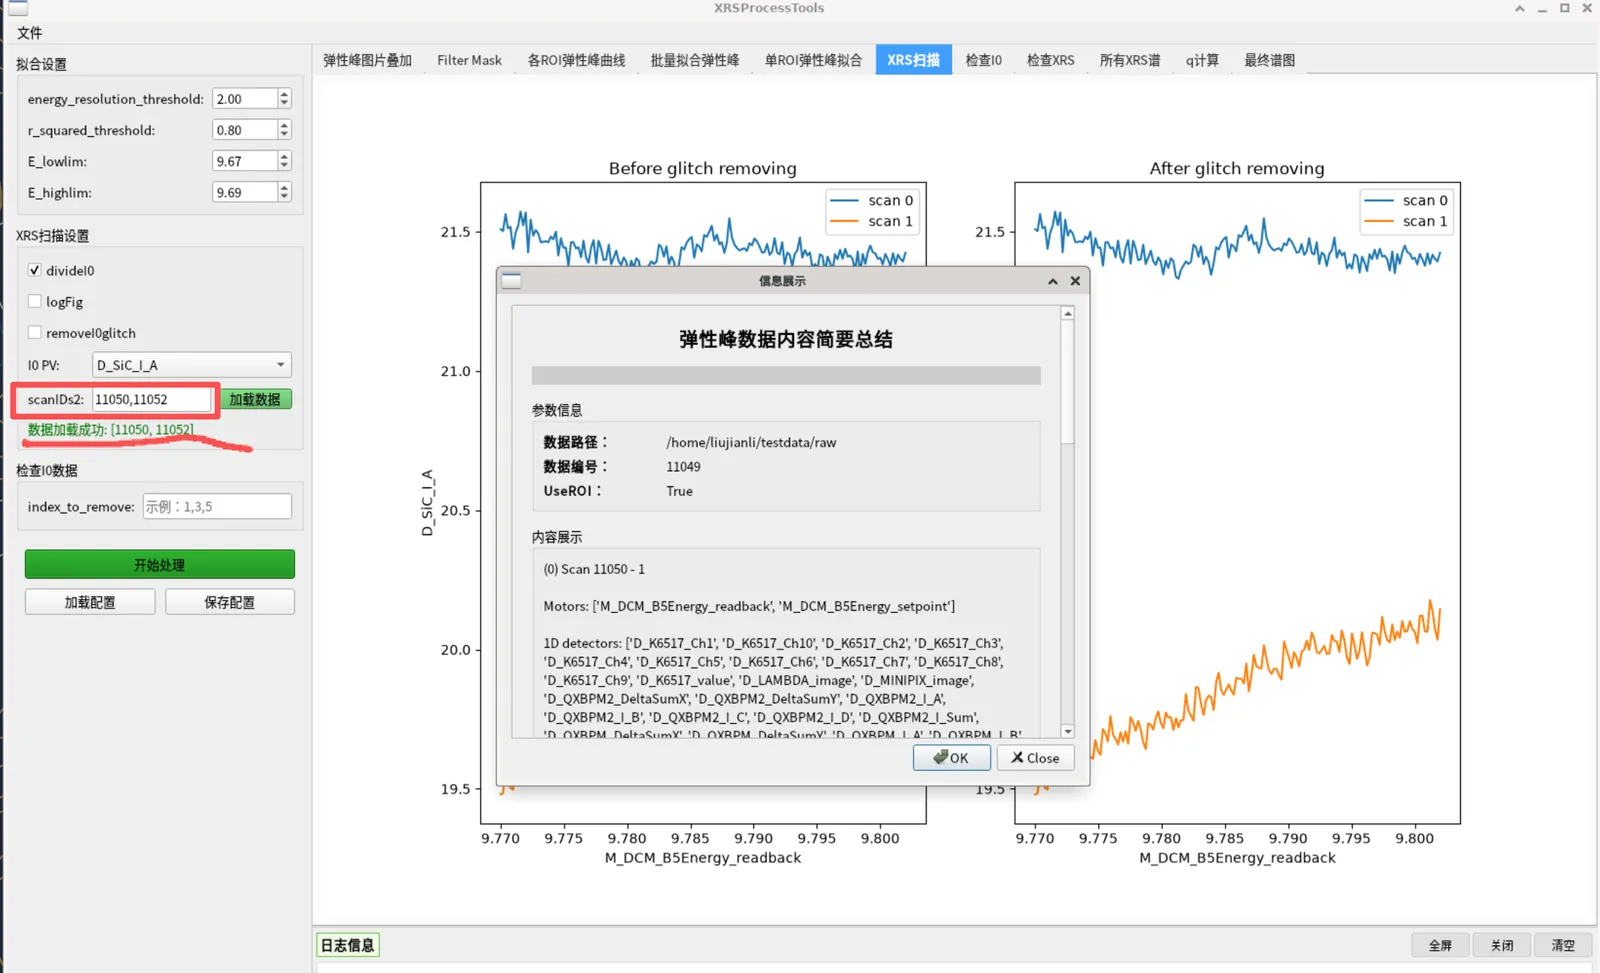
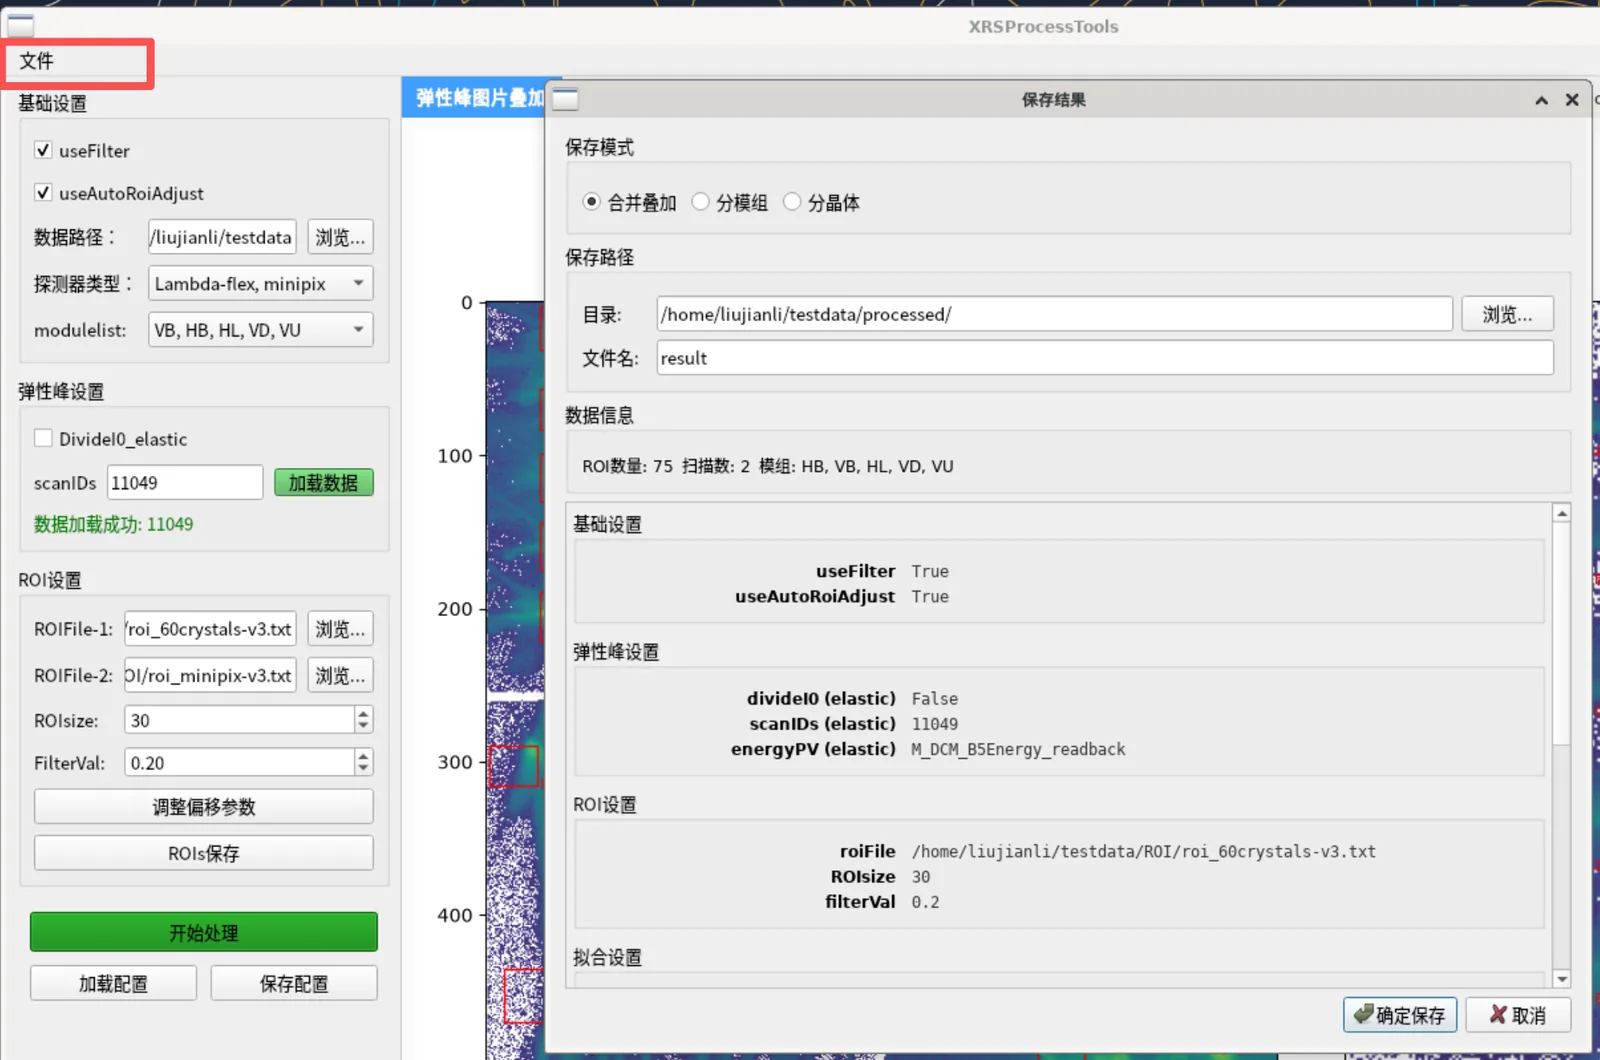
Loading data: pick .nxs files or load by scan ID, with a summary in the log
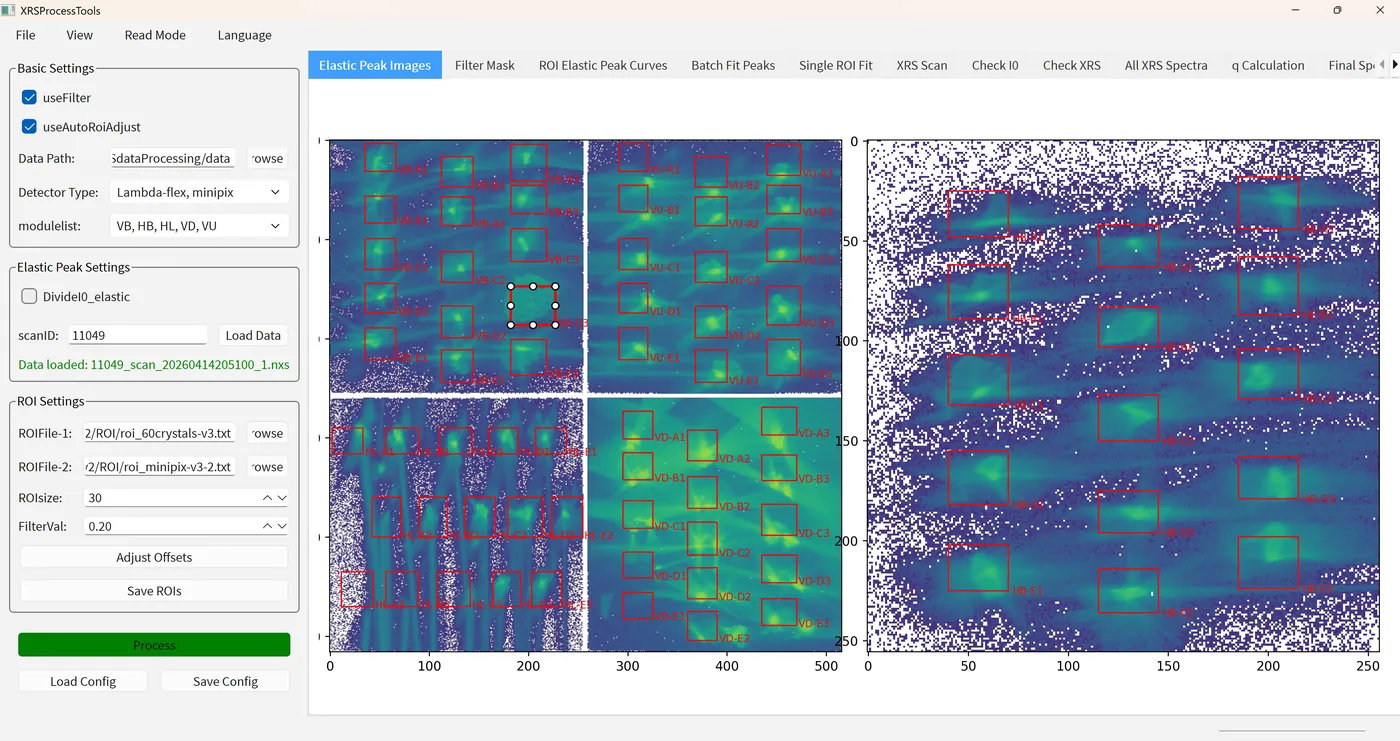
Tab 0: elastic-peak 2D image with crystal ROIs overlaid
ROI editing: drag boxes to adjust, or auto-centre on the brightest pixel
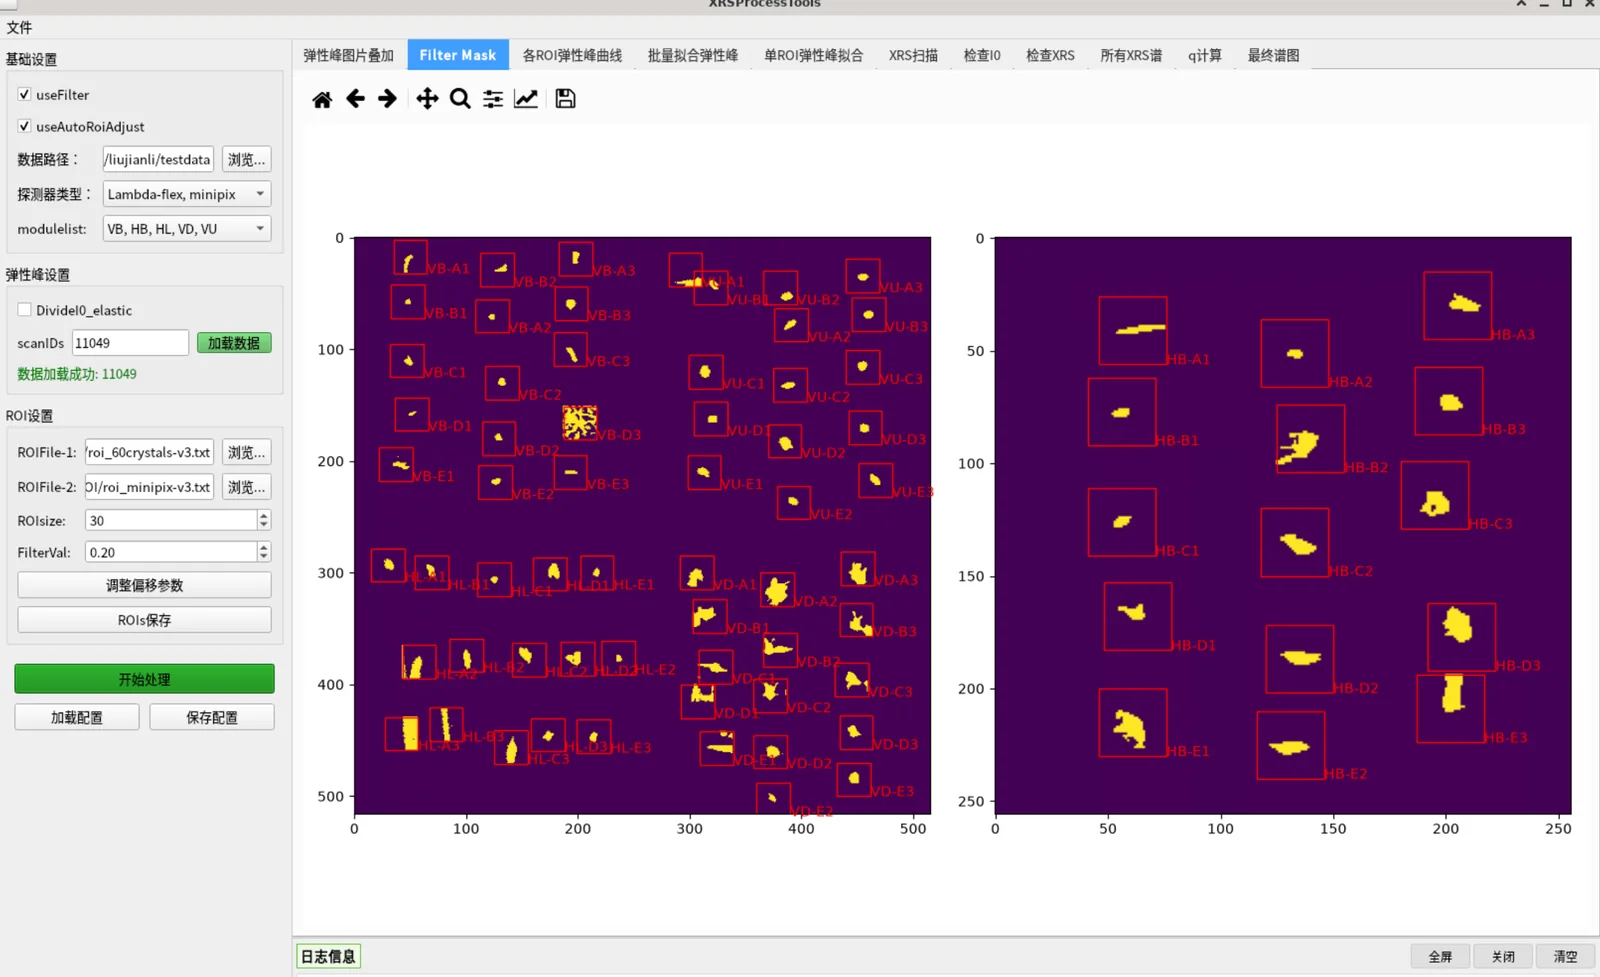
Tab 1: threshold filter mask that removes low-intensity pixels
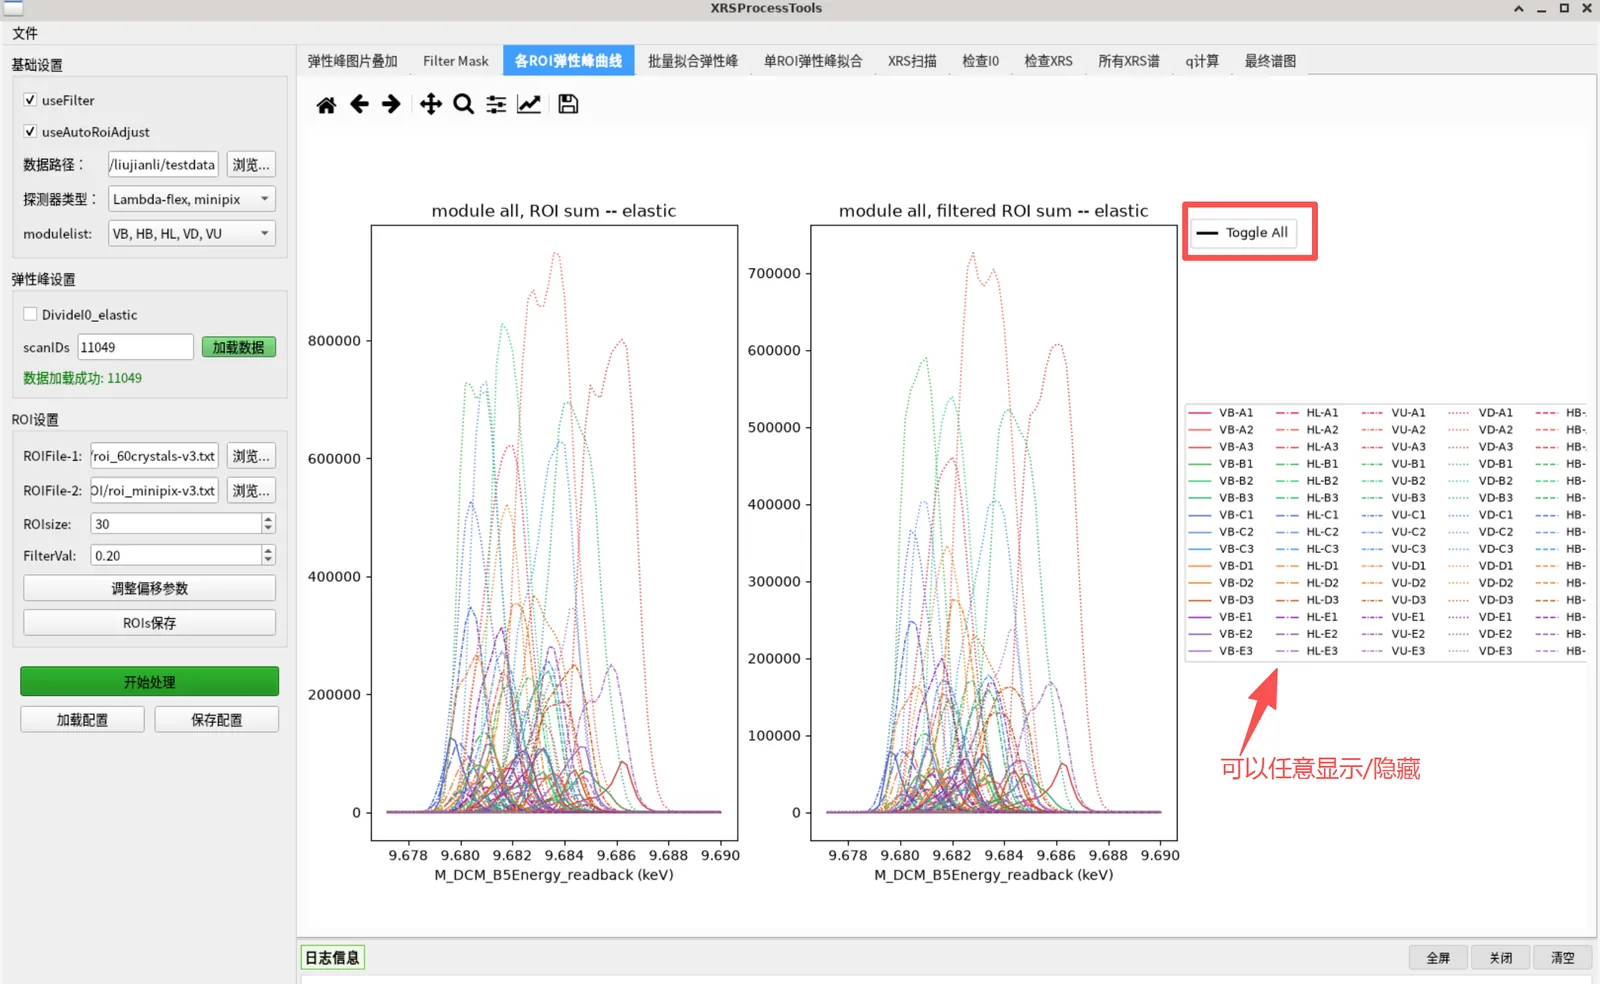
Tab 2: elastic-peak curves of every ROI (raw sum)
Tab 3: batch Lorentzian fitting results with bad-fit flags
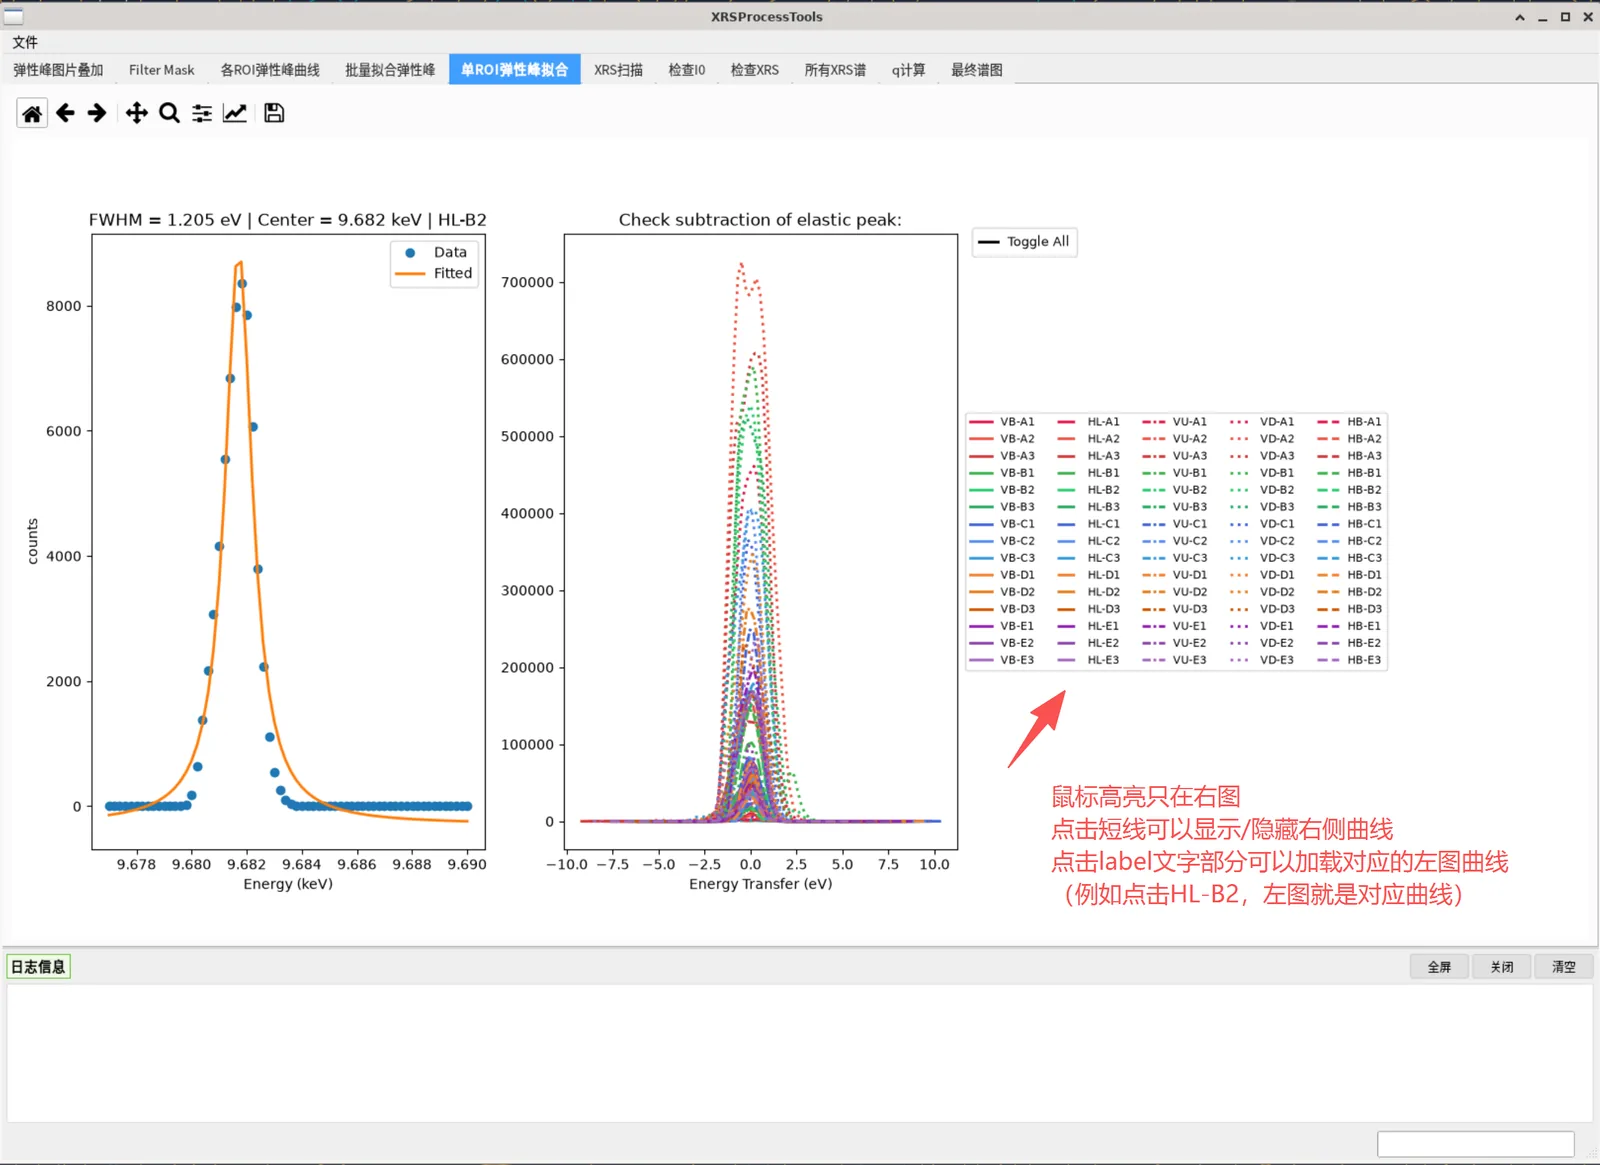
Tab 4: single-ROI fit check and energy-transfer view
Tab 5: I0 versus energy before and after normalisation and glitch removal
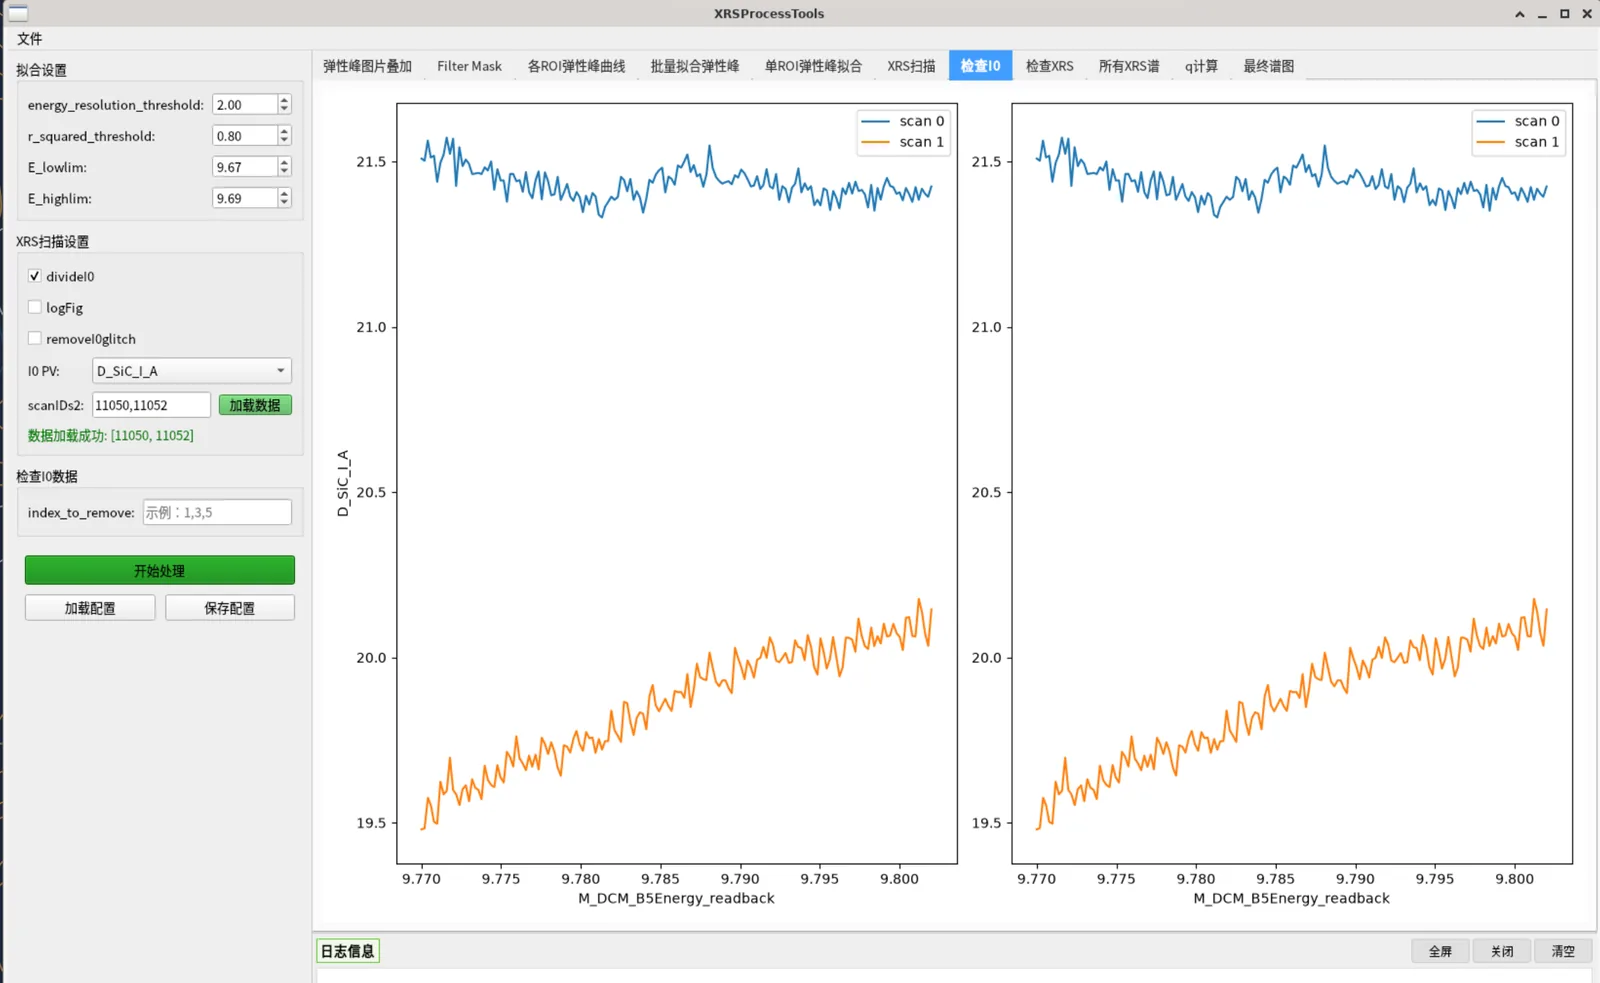
Tab 6: I0 comparison before and after removing selected scans
Tab 7: stacked 2D XRS detector image with ROI coverage
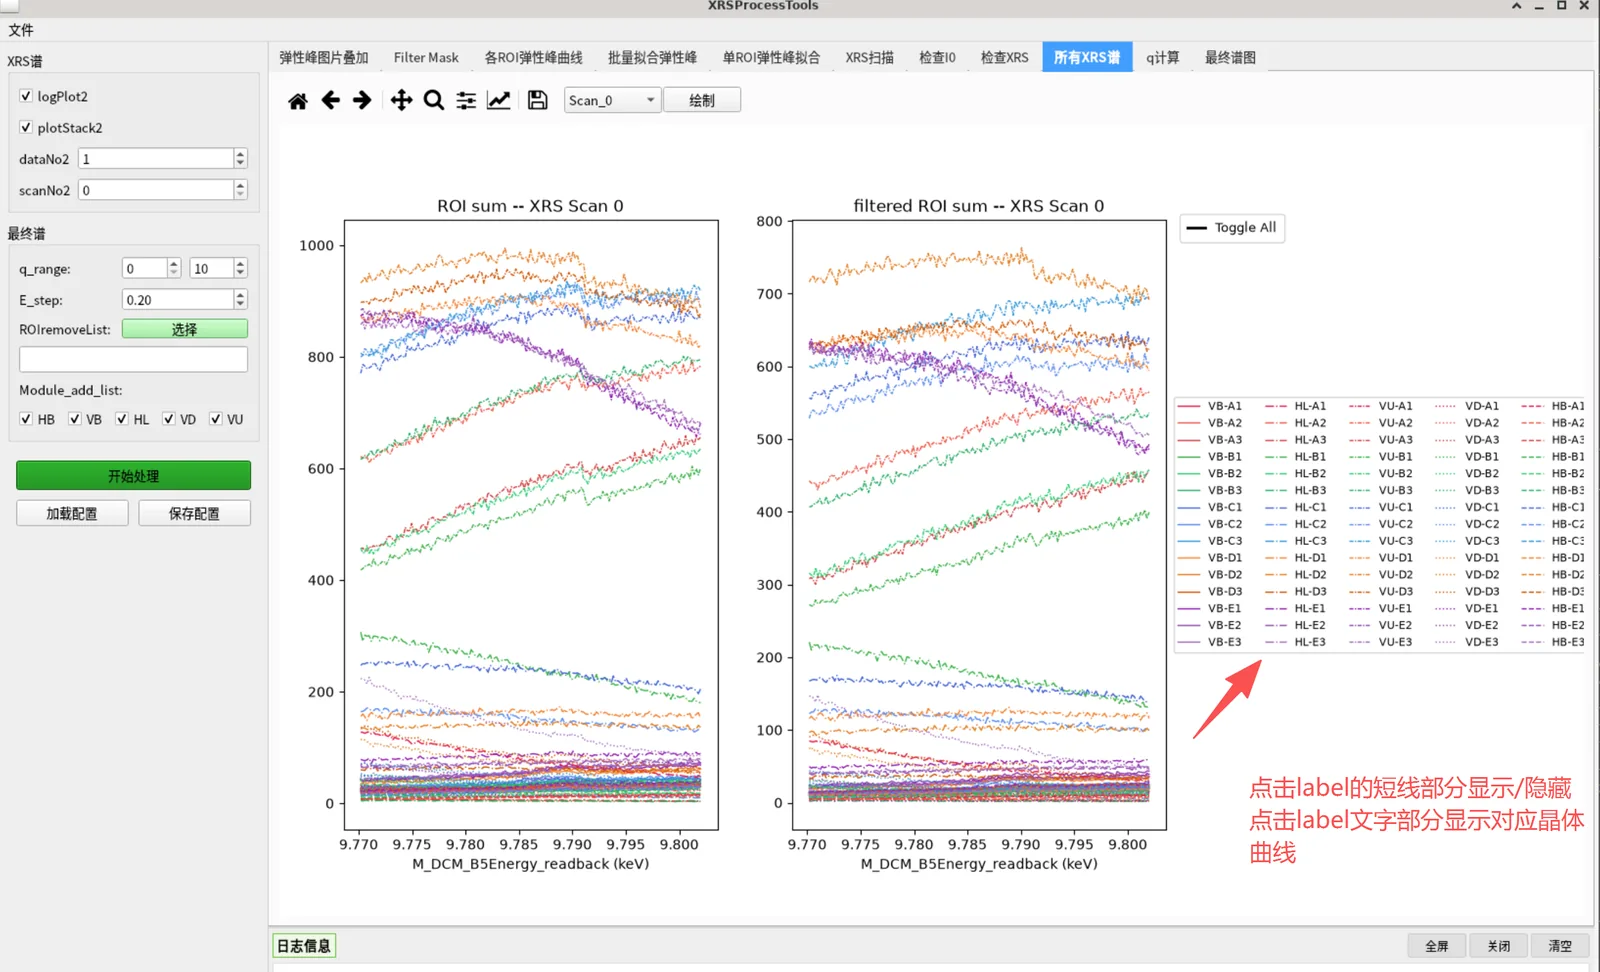
Tab 8: XRS spectra of every scan and ROI (raw and filtered)
Tab 9: computed momentum transfer q
Tab 10: final energy-transfer spectrum from interpolated stacking
Saving results: merged, per-module or per-crystal modes
Saving and loading the full parameter set as JSON

Features & algorithms

Legacy and new data layouts

Supports legacy external links, dual detectors (lambda + minipix) and the new DAQ layout with the 3D dataset under entry/data; I0 channels are located automatically in entry/data and entry/instrument.

Two loading modes

Pick .nxs files one by one (accumulating, with clear), or load by scan ID with prefix matching under the data path — convenient for processing a batch of scans.

ROI positioning and interaction

Overlay crystal ROIs on the 2D detector image, drag to adjust, auto-centre on the brightest pixel and resize, and build an intensity mask with a threshold.

Lorentzian elastic peak fitting

Fits every ROI and reports centre energy, FWHM, height, background and R²; crystals with poor fits are excluded automatically.

Momentum transfer q selection

Computes q and its uncertainty from the fixed scattering angles of each module, and selects ROIs by q range to balance statistics and resolution.

Multi-scan interpolation

Interpolates and stacks spectra from many scans and ROIs onto a common energy grid, with module selection and manual ROI exclusion.

Results and configuration

Merged / per-module / per-crystal export modes with fit results and a record of all parameters; save and reload the full parameter set as JSON.

Documentation & manual

Online guideRead the full guide in the browser, with 15 UI screenshots and a Chinese / English switch.→Download the guideChinese PDF, Chinese Markdown and English Markdown.→

Available versions

VersionPlatformFile sizePublishedDownloads
No package yet — use it online in TORCH.

Contacts

刘
刘建利
liujianli@ihep.ac.cn

Contact the maintainers above for usage, adaptation or customisation.